From Insurance Insights to Everyday Life: A Look Back at Conversations That Matter

Over the past few years here, one thing has become clear: the topics that matter most are the ones that impact everyday people in real life. From protecting families financially to improving personal health and building long-term wealth, the conversations shared across social media have focused on practical advice, real experiences, and personal growth.

Here’s a look back at some of the biggest themes that resonated with readers and followers alike.

Dirt path winding through grassy hills toward a city skyline at sunset with glowing navigation icons.
A scenic dirt path leads to a city skyline at sunset, with glowing navigation and connectivity icons along the trail.

Insurance Isn’t Just a Bill… It’s a Financial Safety Net

One recurring topic has been the importance of understanding insurance beyond the monthly premium. Conversations around auto insurance scores, homeowner protection, life changes, and shopping for coverage highlighted how important it is to make informed decisions.

Many drivers don’t realize that constantly switching insurance companies can sometimes hurt their long-term pricing and stability. Insurance history, payment consistency, claim frequency, and credit-related factors often play a role in how rates are calculated. The key message shared over time has been simple:

✅ Shop smart
✅ Compare coverage… not just price
✅ Understand what you’re buying
✅ Protect yourself before problems happen

There were also important discussions about protecting families after the loss of a spouse. Topics included updating estate documents, reviewing beneficiaries, adjusting homeowners and auto insurance policies, and making sure financial accounts are organized during difficult times.

Health and Sleep Matter More Than We Admit

Another major focus centered around health and quality of life, especially sleep.

Personal experiences discussing CPAP therapy opened conversations for many people struggling silently with exhaustion, poor sleep quality, and untreated sleep apnea. The message was relatable because it focused on real-life improvements instead of medical jargon.

Many readers connected with the idea that better sleep can improve:

  • Energy levels
  • Mood and mental clarity
  • Blood pressure
  • Productivity
  • Overall quality of life

The discussions also honestly addressed the adjustment period that comes with CPAP use, reminding people that long-term health improvements often require patience and consistency.

Mental Health Conversations Continue to Break Stigma

Mental health awareness became another important topic throughout the years. Rather than focusing only on diagnoses or labels, the message centered around perseverance, growth, and finding purpose despite difficult seasons.

The overall tone remained encouraging:

Every day is another opportunity to keep moving forward.

Readers responded positively to honest conversations about stress, emotional struggles, and the importance of seeking support while continuing to pursue productive and meaningful lives.

Investing Conversations Focused on Long-Term Thinking

Investment-related discussions also attracted strong engagement, especially around dividend-paying companies and emerging growth opportunities.

Articles and commentary involving companies like General Mills (GIS) and Ondas Holdings (ONDS) explored the balance between stability and growth potential.

Topics included:

  • Dividend investing
  • Market volatility
  • Long-term portfolio strategy
  • Risk management
  • Emerging technology opportunities

One consistent theme stood out:

📈 Investing is not about chasing hype every day it’s about building disciplined habits over time.

Transparency also remained important, with disclosures shared whenever positions in discussed companies were personally owned.

Vintage balance scale weighing health symbols, money, tech devices, and family icons.
A vintage scale balancing symbols of health, money, technology, and family.

Technology, Sustainability, and Everyday Innovation

Discussions around sustainability and technology showed how rapidly the world is changing. Topics ranged from electric vehicles and smart homes to how innovation is reshaping the insurance industry itself.

As more households adopt connected devices and cleaner technologies, conversations emphasized how these changes may impact:

  • Insurance pricing
  • Risk assessment
  • Home safety
  • Driving habits
  • Long-term financial savings

The growing overlap between technology and personal finance continues to create opportunities for consumers willing to stay informed.

Why These Conversations Connected With People

The reason these topics gained attention is because they were grounded in real life.

They weren’t just about headlines or trends they focused on:

✔ Protecting families
✔ Improving health
✔ Building financial stability
✔ Encouraging personal growth
✔ Preparing for the unexpected

In a social media environment often dominated by negativity and noise, practical conversations that educate, encourage, and empower people continue to stand out.

Key Takeaway

Over the years, these discussions have shown that everyday decisions can have a lasting impact. Whether it’s reviewing an insurance policy, improving sleep, investing for the future, or simply finding ways to stay positive during difficult times, small steps often create meaningful long-term results.

The conversations will continue because life keeps evolving, and staying informed matters more than ever.

General Mills ($GIS): High Dividend Yield and Value Potential Draw Investor Attention

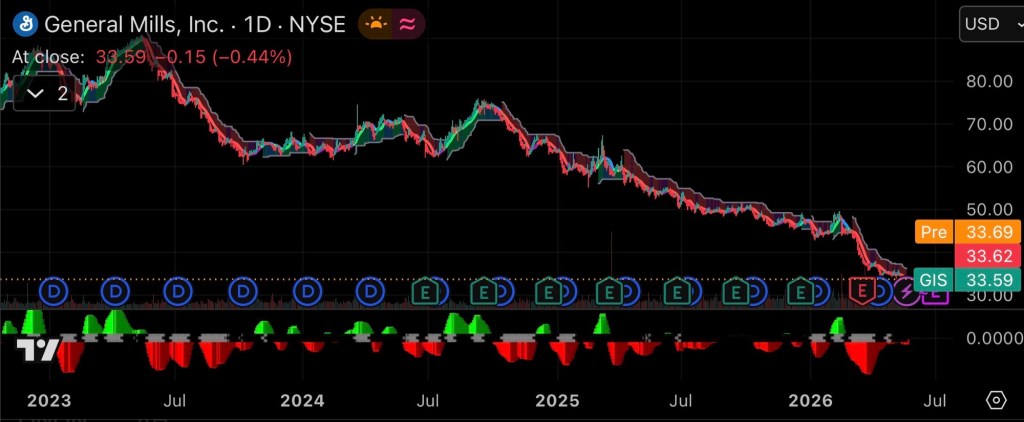
GIS, one of the most recognizable consumer staples companies in the United States, has increasingly attracted income-focused investors as its stock price has declined significantly from recent highs. Known for household brands such as Cheerios, Pillsbury, Häagen-Dazs, Betty Crocker, and Blue Buffalo, General Mills now offers one of the highest dividend yields in the packaged food sector.

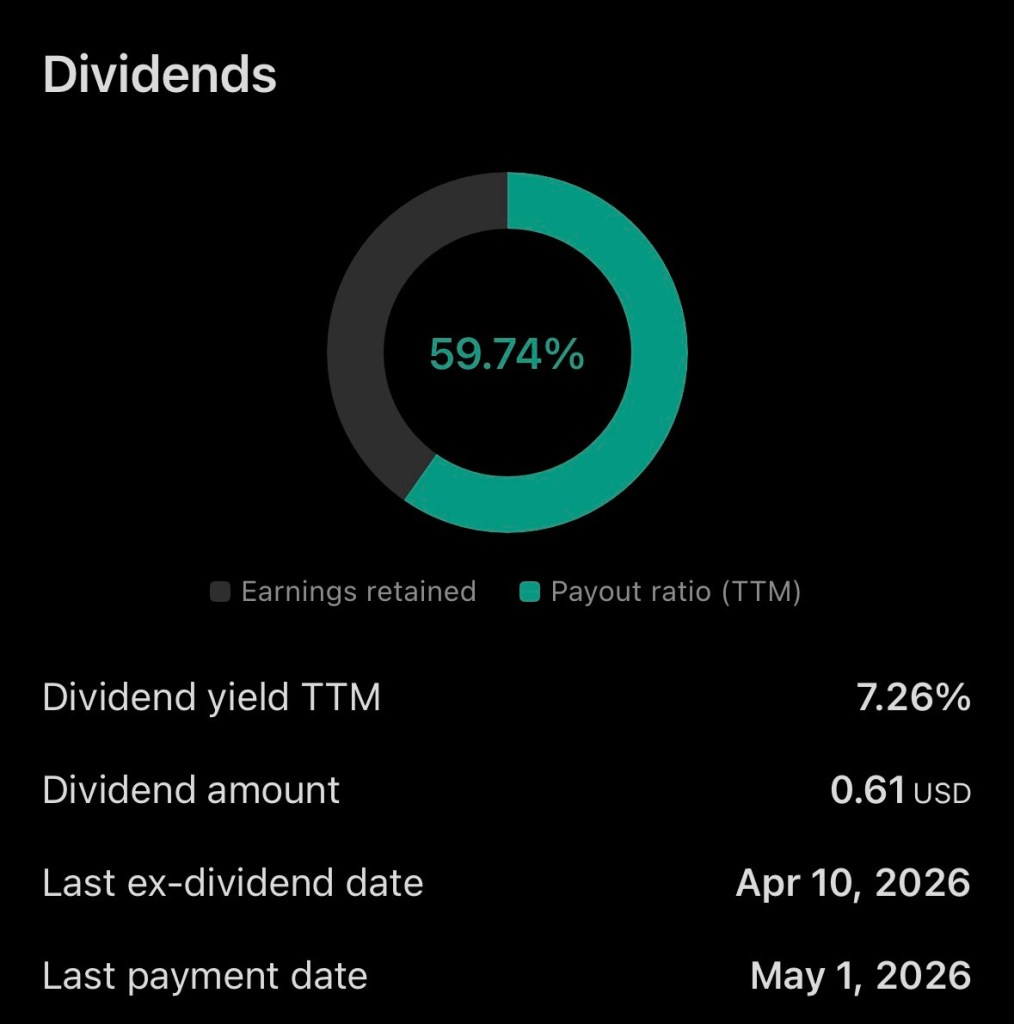
As of May 2026, shares of General Mills are trading near multi-year lows around the mid-$30 range after previously trading above $55 within the past year. The decline has pushed the company’s dividend yield above 7%, a level rarely seen for a mature consumer staples company with decades of dividend history.

Line and bar chart depicting financial growth trends from January to December
A vibrant chart showing fluctuating financial growth trends over a year

Strong Dividend Remains a Key Attraction

General Mills currently pays an annual dividend of approximately $2.44 per share, translating to a dividend yield above 7%. The company has maintained consistent quarterly dividend payments and has modestly increased its payout in recent years. The payout ratio remains near 60%, which many analysts still consider manageable for a stable consumer products company.

For income investors, the yield alone may make GIS an attractive defensive holding during periods of market volatility and economic uncertainty. Consumer staples companies historically perform better during slower economic periods because consumers continue purchasing essential food products regardless of broader market conditions.

Financial Performance Shows Both Strengths and Challenges

While the dividend remains attractive, General Mills has faced operational headwinds over the past year. Revenue has declined modestly, with trailing twelve-month revenue around $18.4 billion, down more than 6% year-over-year. Earnings and profit margins have also softened as consumers increasingly seek lower-cost alternatives amid inflationary pressures.

The company recently reduced portions of its fiscal 2026 guidance, citing weaker consumer demand and increasing competition from private-label food brands. Management has acknowledged that shoppers are becoming increasingly price sensitive and are prioritizing value-based purchases.

Despite these challenges, General Mills continues to generate substantial cash flow and maintains strong brand recognition across multiple product categories. The company is also investing heavily in innovation, protein-focused products, pet food expansion, and operational efficiencies aimed at improving long-term growth.

Why Some Investors See Upside Potential

Although sentiment surrounding GIS has weakened, several valuation metrics suggest the stock could offer upside potential at current levels.

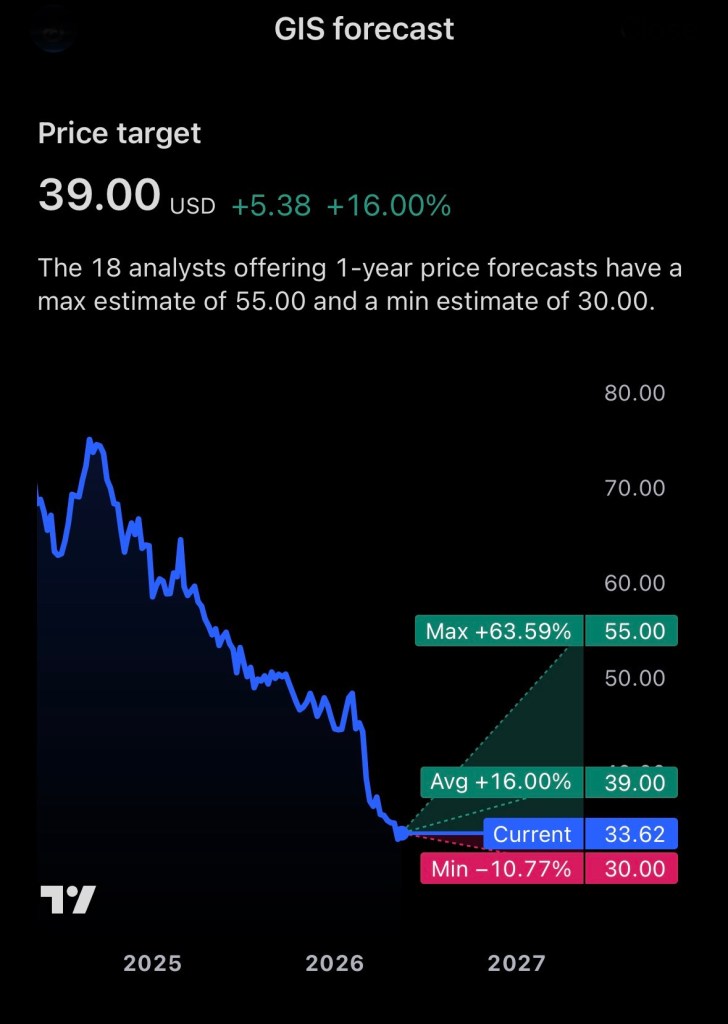
General Mills currently trades at a price-to-earnings ratio below 9, substantially lower than many competitors in the consumer staples sector. Analyst price targets average around $42 per share, implying potential upside of nearly 18% from recent trading levels.

Bullish investors argue that much of the negative outlook may already be reflected in the current stock price. If inflation moderates, consumer spending stabilizes, and management successfully executes its growth initiatives, GIS could potentially see both earnings stabilization and multiple expansion over the next 12 to 24 months.

Additionally, the combination of a high dividend yield and possible capital appreciation may appeal to long-term dividend growth investors seeking total return opportunities.

Risks Investors Should Monitor

Despite the attractive valuation and dividend yield, risks remain. Persistent inflation, changing consumer habits, private-label competition, and margin compression could continue pressuring earnings. The packaged food industry also faces ongoing challenges from shifting dietary preferences and increased competition from health-focused brands.

Investors should also monitor debt levels, input cost inflation, and whether the company can successfully restore organic sales growth over upcoming quarters.

Final Thoughts

General Mills appears to represent a classic value-versus-growth debate. The company is no longer viewed as a high-growth stock, but its depressed valuation, established global brands, and substantial dividend yield could present an opportunity for patient investors willing to accept slower growth and near-term volatility.

For dividend-focused portfolios, GIS may warrant consideration as a high-income consumer staples holding, particularly if management can stabilize sales trends and maintain strong free cash flow generation.

Disclosure

The author currently owns a position in General Mills ($GIS). This article is for informational purposes only and should not be considered financial advice. Investors should conduct their own research before making investment decisions.

References (APA Format)

MacroTrends. (2026). General Mills revenue 2012–2026. Retrieved May 21, 2026, from MacroTrends

Reuters. (2026, February 17). General Mills’ forecast cut from demand hit rattles packaged-food stocks. Retrieved May 21, 2026, from Reuters

Stock Analysis. (2026). General Mills (GIS) dividend history, dates & yield. Retrieved May 21, 2026, from Stock Analysis Dividend Page

Stock Analysis. (2026). General Mills (GIS) financials & income statement. Retrieved May 21, 2026, from Stock Analysis Financials

Stock Analysis. (2026). General Mills (GIS) stock price & overview. Retrieved May 21, 2026, from Stock Analysis Overview

MarketWatch. (2026). Cheerios parent General Mills says it will sacrifice some profit to drive sales amid cautious consumers. Retrieved May 21, 2026, from MarketWatch Article

Ondas Holdings ($ONDS): A High-Risk, High-Reward Play on Autonomous Defense and AI Infrastructure

Ondas Holdings has rapidly emerged as one of the more closely watched small-cap companies in the autonomous systems and defense technology sector. The company operates through its Ondas Autonomous Systems division, focusing on AI-powered drone platforms, counter-drone defense technologies, and private wireless infrastructure designed for critical industries and government agencies.

Drone flying over a border fence scanning the area with sensors at sunset
A drone scans a border fence at sunset using advanced sensors.

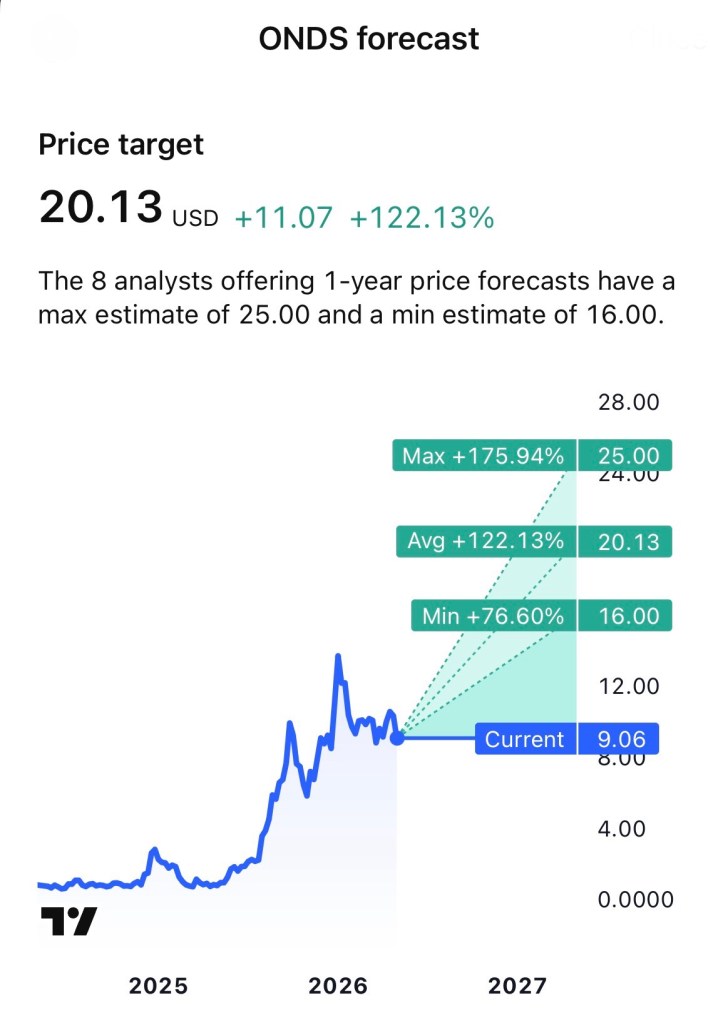
Over the past year, investor interest in ONDS has accelerated as geopolitical tensions, rising defense spending, and demand for autonomous security systems have expanded globally. The company’s partnerships, acquisitions, and expanding backlog have positioned it as a speculative growth stock with significant upside potential but also elevated volatility and execution risk.

According to recent company updates, Ondas reported preliminary 2025 revenue between $49.7 million and $50.7 million, substantially ahead of prior guidance. Management also increased its 2026 revenue outlook to as much as $375 million, supported by growing defense contracts and autonomous drone deployments.

The Core Investment Thesis

Ondas is attempting to build an integrated autonomous intelligence ecosystem combining:

  • Autonomous drones
  • Counter-UAS defense systems
  • AI-driven operational software
  • Remote wireless communications infrastructure
  • Border and critical infrastructure monitoring systems

Its flagship technologies include:

  • Optimus drone systems
  • Iron Drone Raider counter-UAS platforms
  • Scout autonomous systems
  • AI-enabled command-and-control architecture

The company has increasingly focused on military, homeland security, and infrastructure applications where demand has accelerated globally.

One of the most notable developments for investors was Ondas’ partnership with Palantir Technologies to integrate Palantir’s AI and data fusion capabilities into Ondas autonomous systems. Analysts believe this partnership could improve scalability and strengthen Ondas’ positioning in next-generation defense operations.

Short-Term Growth Outlook

In the short term, ONDS remains heavily momentum-driven. Several catalysts could impact the stock over the next 6–12 months:

1. Expanding Defense Contracts

Ondas recently announced:

  • Multi-million-dollar European airport security contracts
  • New Middle East counter-drone orders
  • A $20 million autonomous border security program

These announcements suggest accelerating commercial adoption of autonomous security systems.

2. Revenue Acceleration

Management forecasts dramatic year-over-year growth in 2026 revenue, supported by an expanding backlog and defense demand. Revenue growth has become one of the primary bullish arguments for the stock.

3. Retail and Institutional Interest

ONDS has gained traction among retail traders and defense-focused growth investors. Increased trading volume and short interest could continue to create sharp price swings.

4. Upcoming Earnings

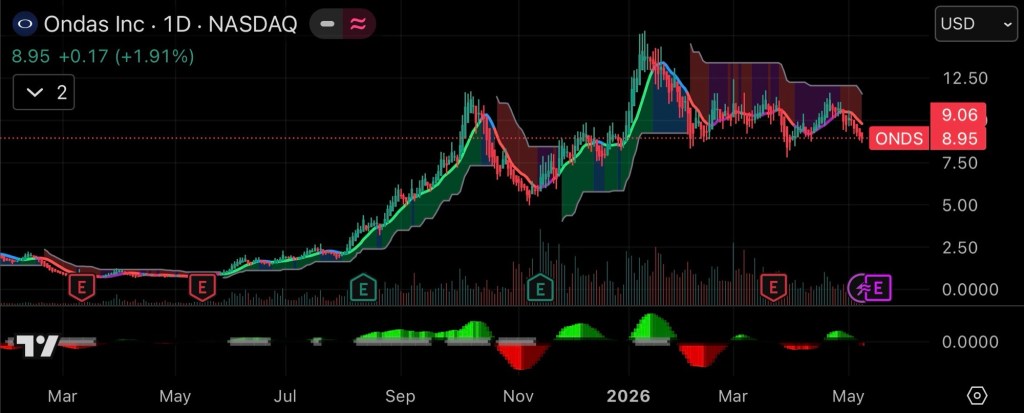
Investors are closely watching the company’s next earnings release scheduled for May 14, 2026, which may provide additional guidance and contract updates.

Long-Term Opportunities

The longer-term opportunity for Ondas centers on becoming a major provider of autonomous infrastructure systems.

Potential long-term drivers include:

  • Global expansion of autonomous defense systems
  • AI-enabled battlefield coordination
  • Smart city and critical infrastructure monitoring
  • Border protection technologies
  • Autonomous aviation and robotics
  • NATO and allied defense modernization

The company also benefits from broader trends in:

  • Defense digitization
  • Drone warfare evolution
  • AI-enhanced surveillance
  • Critical infrastructure protection

If management successfully scales operations and improves profitability, Ondas could evolve from a speculative small-cap into a more established defense technology company over the next 3–5 years.

However, risks remain substantial.

Key Risks Investors Should Monitor

Despite its growth story, ONDS carries elevated risk factors:

  • Continued net losses
  • Potential shareholder dilution
  • Dependence on government contracts
  • Execution risk on scaling production
  • Competitive pressure from larger defense firms
  • High stock volatility
  • Heavy reliance on future growth projections

The company is still in an aggressive expansion phase and has not yet established consistent profitability.

Competitive Landscape

CompanyPrimary FocusMarket PositionRelative Financial Strength
Ondas HoldingsAutonomous drones, counter-UAS, AI systemsEmerging small-cap disruptorSpeculative / growth-stage
AeroVironmentMilitary drones and loitering munitionsEstablished defense contractorStrong
Palantir TechnologiesAI defense software and analyticsAI infrastructure leaderVery strong
Kratos Defense & Security SolutionsAutonomous defense systemsMid-cap defense innovatorModerate to strong
DroneShieldCounter-drone defense technologySpecialized counter-UAS playerModerate

ONDS Stock Performance Snapshot

MetricData
Current Share PriceApproximately $9
52-Week PerformanceSignificant volatility with major upside swings
Market CapApproximately $2.35 billion
SectorAerospace & Defense Technology
ProfitabilityCurrently unprofitable
Revenue TrendRapid growth trajectory
Analyst SentimentBullish but speculative

Market data current as of May 2026.

Financial Strength Overview

CategoryAssessment
Revenue GrowthStrong
Cash PositionImproving
Debt ManagementModerate risk
ProfitabilityWeak currently
Backlog GrowthStrong
Institutional InterestIncreasing
Share Dilution RiskElevated

Final Analysis

Ondas Holdings represents one of the more aggressive speculative opportunities in the autonomous defense and AI-enabled drone market. The company is benefiting from powerful macro trends including rising defense budgets, geopolitical instability, and increased demand for autonomous systems.

For aggressive growth investors, ONDS may offer substantial upside if management successfully executes on revenue expansion and large-scale deployment opportunities. However, the stock remains highly volatile and should likely be viewed as a speculative position within a diversified portfolio rather than a conservative core holding.

Investors considering ONDS should closely monitor:

  • Earnings growth
  • Contract execution
  • Cash burn
  • Share dilution
  • Defense spending trends
  • AI partnership developments

Disclosure

The author currently owns a position in Ondas Holdings $ONDS. This article reflects personal opinions and is intended for informational purposes only. It should not be considered financial advice or a recommendation to buy or sell securities. Investors should conduct their own due diligence and consult a licensed financial advisor before making investment decisions.

References

Enterprise Products Partners (EPD): High-Yield Stability Meets Measured Growth in 2026

Enterprise Products Partners L.P. (NYSE: EPD), one of the largest midstream energy operators in North America, continues to attract income-focused investors in 2026 with a combination of steady cash flows, a strong dividend track record, and modest but reliable growth prospects.

Power plant with cooling towers and electrical substation with transmission lines at sunset
A power plant surrounded by transmission towers during a vibrant sunset

Stock Performance and Current Price

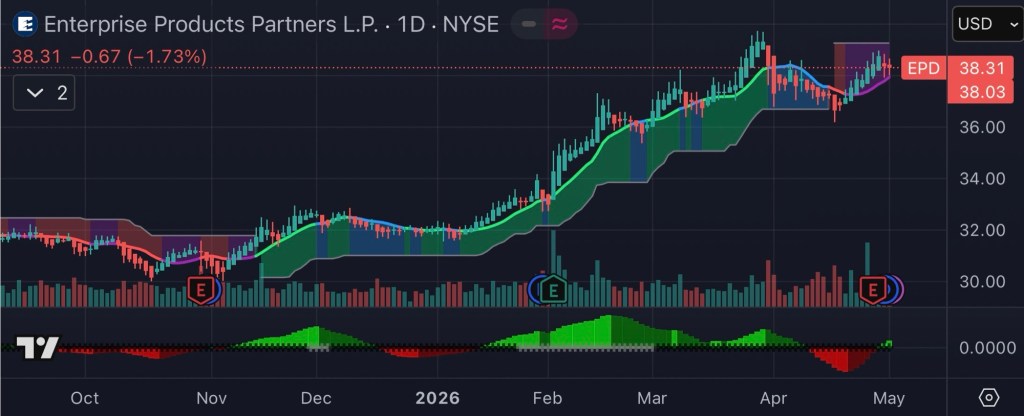
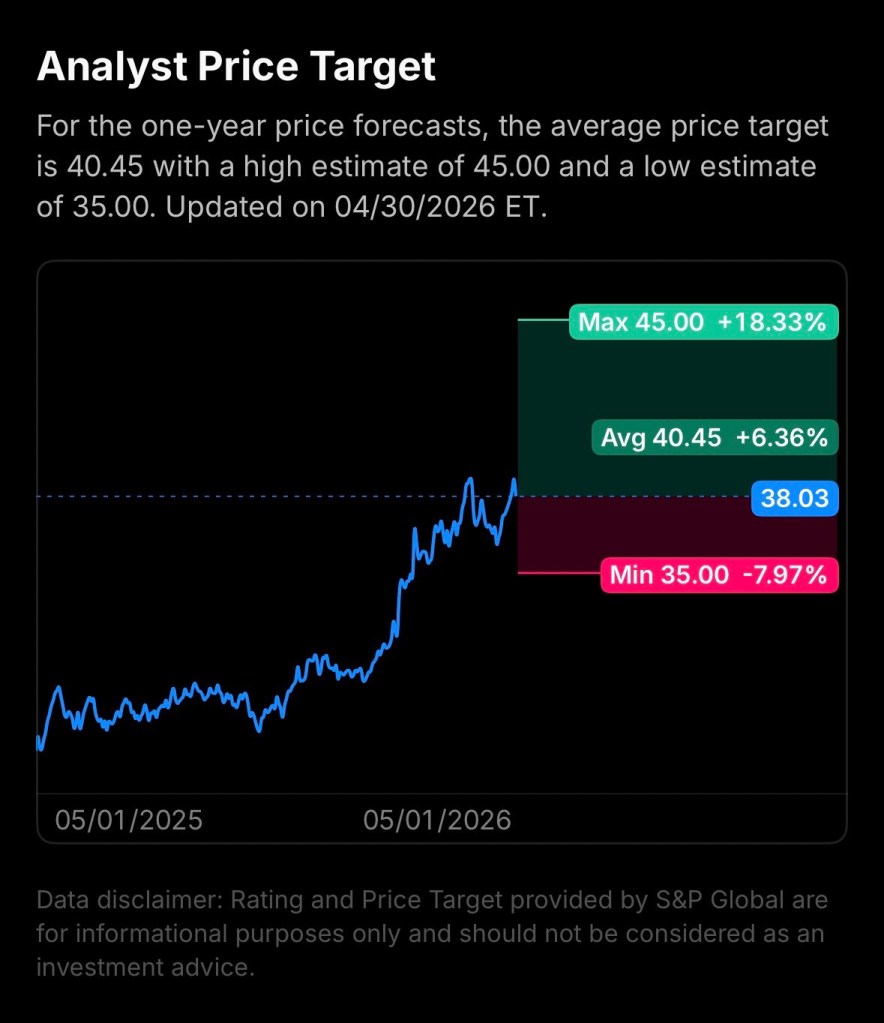
As of late April 2026, EPD shares are trading in the mid-to-high $30 range (approximately $36–$38 per unit), slightly below analyst consensus targets near $39.50.

The stock has demonstrated resilience this year, gaining over 20% year-to-date amid improving fundamentals and renewed investor interest in energy infrastructure assets.

Despite some short-term volatility and minor earnings misses, the broader trend remains constructive, supported by stable demand for oil, natural gas liquids (NGLs), and export services.

Dividend Profile: A Core Income Play

Enterprise Products Partners remains a standout in the income investing space:

  • Annual distribution: ~$2.20 per unit
  • Quarterly payout: $0.55
  • Dividend yield: ~5.8%–6.0%
  • Dividend growth streak: 28 consecutive years

The company recently reaffirmed its quarterly distribution for 2026, reflecting a ~2–3% year-over-year increase, consistent with its conservative capital return strategy.

Unlike high-growth equities, EPD prioritizes distribution stability and coverage, maintaining payout ratios supported by strong operating cash flow.

Financial Strength and Operational Momentum

Recent earnings and operational data highlight steady performance:

  • Q1 2026 EBITDA: ~$2.7 billion
  • Operating income growth: +8%
  • Revenue beat expectations despite EPS miss

Enterprise’s diversified asset base spanning pipelines, storage, processing, and export terminals continues to generate predictable fee-based income, insulating the business from commodity price volatility.

Growth Outlook: Moderate in 2026, Stronger Beyond

Looking ahead, analysts expect measured growth in 2026, with stronger acceleration into 2027:

  • 2026 outlook: Transitional year with stable cash flow
  • 2027+: Potential double-digit EBITDA and cash flow growth as new projects come online
  • Capital projects pipeline: ~$6 billion in infrastructure investments

Wall Street forecasts also indicate gradual earnings expansion:

  • 2026 estimated earnings: ~$6.1B
  • 2027 estimated earnings: ~$6.8B

This positions EPD as a “slow compounder” rather than a high-growth equity ideal for long-term income portfolios.

Key Investment Highlights

MetricValue / Insight
Current Stock Price~$36–$38
Dividend Yield~5.8%–6.0%
Annual Distribution~$2.20
Dividend Growth Streak28 years
2026 Stock Performance~+20% YTD
EBITDA (Q1 2026)~$2.7B
Growth OutlookModerate 2026, stronger 2027+
Analyst Target~$39.50

Investment Thesis

Enterprise Products Partners continues to deliver on its core value proposition: reliable income with low volatility and gradual capital appreciation.

Bull Case:

  • Durable, fee-based midstream business model
  • Strong balance sheet and distribution coverage
  • High yield relative to broader equity markets
  • Visible long-term growth pipeline

Bear Case:

  • Limited near-term upside due to mature asset base
  • Slower dividend growth compared to peers
  • Sensitivity to energy demand cycles and interest rates

Bottom Line

For 2026, Enterprise Products Partners is best viewed as a defensive income vehicle rather than a growth stock. Investors seeking consistent yield and stability in uncertain markets may find EPD particularly attractive, while those pursuing aggressive capital gains may look elsewhere.

With a near-6% yield, a decades-long dividend track record, and improving long-term growth catalysts, EPD remains a cornerstone holding in the midstream energy sector.

Disclosure Statement

Disclosure: The author currently holds a position in Enterprise Products Partners L.P. (NYSE: EPD). This article is for informational purposes only and should not be considered financial advice. Investors should conduct their own due diligence or consult a licensed financial professional before making investment decisions.


References (APA Format)

Yahoo Finance. (2026). Enterprise Products Partners L.P. (EPD) stock price, news, and analysis. Retrieved May 2, 2026, from https://finance.yahoo.com/

MarketBeat. (2026). Enterprise Products Partners dividend history and yield. Retrieved May 2, 2026, from https://www.marketbeat.com/

Simply Wall St. (2026). Enterprise Products Partners distribution updates and analysis. Retrieved May 2, 2026, from https://simplywall.st/

Intellectia. (2026). Enterprise Products Partners starts 2026 strong with stock gains. Retrieved May 2, 2026, from https://intellectia.ai/

The Motley Fool. (2026). Energy dividend stocks outlook and analysis. Retrieved May 2, 2026, from https://www.fool.com/

Seeking Alpha. (2026). Enterprise Products Partners: Growth outlook and capital projects. Retrieved May 2, 2026, from https://seekingalpha.com/

WallStreetZen. (2026). EPD stock forecast and earnings projections. Retrieved May 2, 2026, from https://www.wallstreetzen.com/

Why NVIDIA Stock is a Smart Long-Term Investment

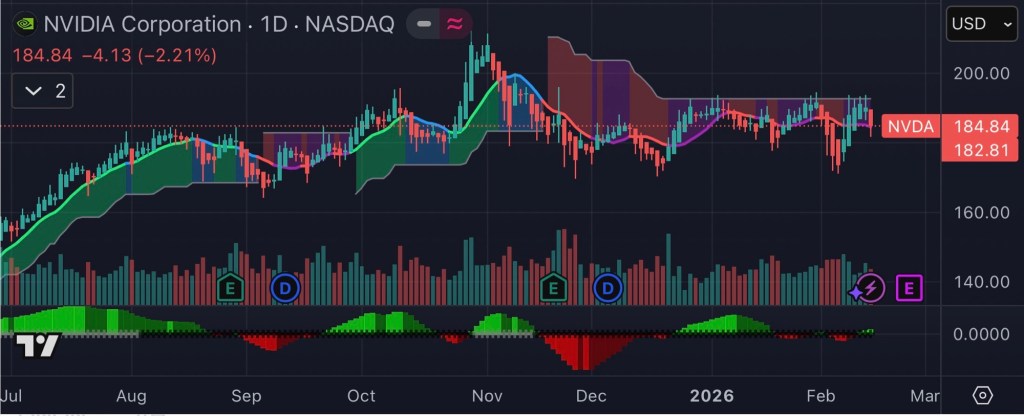
Despite recent volatility and short-term investor hesitation, NVIDIA (NASDAQ: NVDA) remains one of the strongest long-term investment opportunities in the global equity market. While the stock has experienced periods of consolidation and suppressed price action relative to its explosive growth, its financial performance, industry dominance, and forward cash flow trajectory suggest that current levels could represent a compelling entry point for long-term investors.


NVIDIA’s Financial Strength Remains Unmatched

NVIDIA’s growth over the past two years has been historic. The company reported $130.5 billion in fiscal 2025 revenue, up 114% year-over-year, along with net income of $72.9 billion, demonstrating extraordinary profitability.

This growth has accelerated further into fiscal 2026:

  • Q3 FY2026 revenue reached $57.0 billion, up 62% year-over-year.
  • Quarterly net income surged to $31.9 billion, representing exceptional margin strength.
  • NVIDIA expects continued momentum, projecting approximately $54 billion in quarterly revenue, indicating sustained demand.

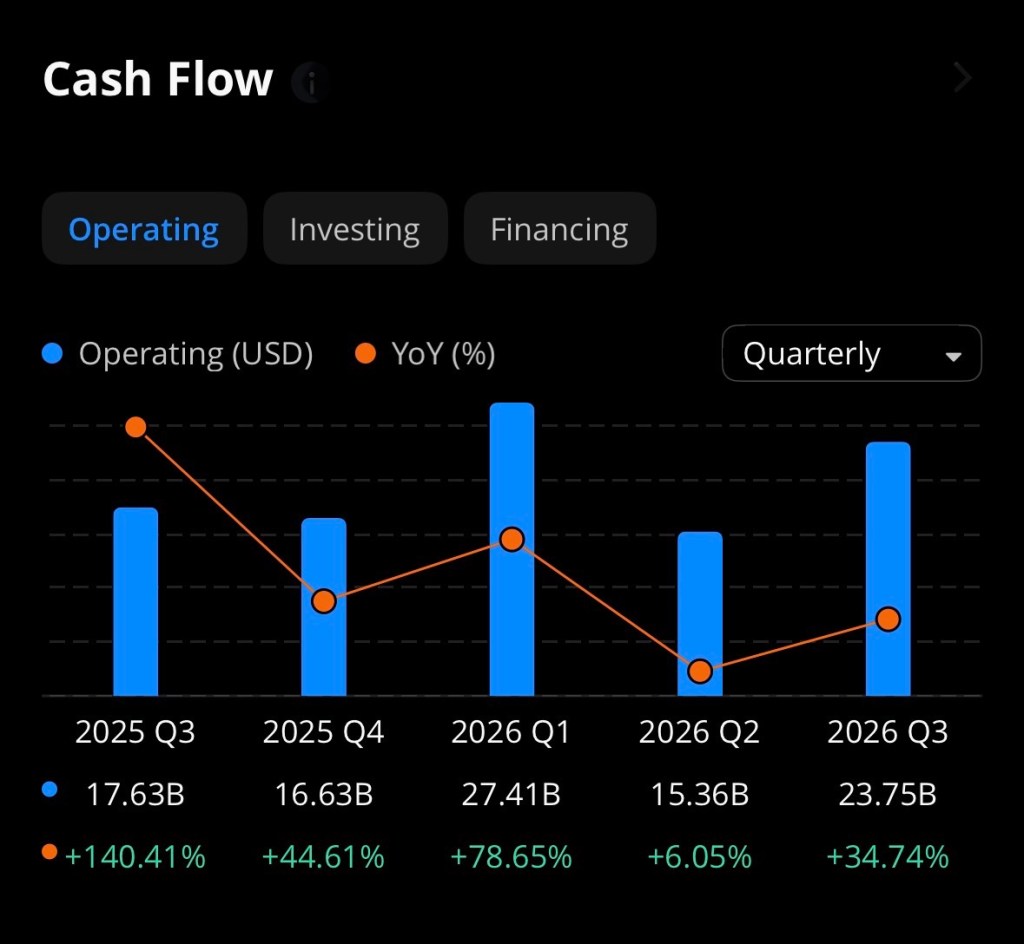
This performance translates directly into massive operating cash flow potential. With operating margins above 60% in recent quarters and explosive AI-related demand, NVIDIA is converting an unusually high percentage of revenue into free cash flow.


AI Demand Is Still in Its Early Stages

The most critical investment thesis for NVIDIA is its central role in powering artificial intelligence infrastructure globally.

Major technology companies are expected to spend over $650 billion on AI infrastructure in 2026, benefiting NVIDIA directly as the primary supplier of advanced GPUs.

Additionally:

  • NVIDIA’s data center segment generated over $51 billion in quarterly revenue, driven primarily by AI demand.
  • Analysts project NVIDIA’s data center revenue alone could reach $300 billion annually by fiscal 2027, reflecting extraordinary long-term growth potential.

This positions NVIDIA not simply as a semiconductor company, but as the foundational infrastructure provider for the global AI economy.


Why the Stock Appears “Suppressed” Despite Strong Fundamentals

NVIDIA’s stock consolidation is primarily driven by macro and investor psychology not deteriorating fundamentals.

Key factors include:

1. Massive Prior Gains Created Consolidation Period

After rising over 1,000% in recent years, periods of sideways movement are normal as valuation multiples normalize.

2. Investor Concerns About AI Spending Sustainability

Some investors worry large capital expenditures from tech giants could reduce near-term cash flow.

However, these investments are directly fueling NVIDIA’s revenue growth.

3. Emerging Competition

Companies like AMD, Broadcom, and custom chips from hyperscalers are increasing competition, but NVIDIA maintains a dominant performance and software ecosystem advantage.


Estimated Cash Flow Comparison: NVIDIA vs Competitors (2026 Projection)

Based on revenue guidance, historical free cash flow margins, and analyst projections, NVIDIA is expected to dramatically outperform competitors in absolute cash flow generation.

CompanyEstimated 2026 RevenueEstimated FCF MarginEstimated 2026 Free Cash FlowAI Market Position
NVIDIA$240B–$280B45%–55%$110B–$150BDominant leader
AMD$45B–$60B20%–25%$9B–$15BStrong competitor
Broadcom$65B–$75B35%–40%$23B–$30BGrowing AI custom chips
Intel$55B–$65B10%–20%$6B–$12BRecovery phase
Qualcomm$42B–$48B25%–30%$11B–$14BMobile AI niche

Methodology:
Estimates derived from:

  • Company financial statements
  • Forward guidance
  • Historical free cash flow conversion ratios
  • AI growth projections

Competitive Advantage: NVIDIA’s True Moat Is Software, Not Just Chips

NVIDIA’s competitive edge extends beyond hardware into software ecosystems such as CUDA, which creates lock-in effects across millions of developers.

Additionally:

  • NVIDIA’s GPUs remain superior for training large AI models.
  • The company continues rapid innovation with new Blackwell and next-generation AI architectures.

This creates extremely high switching costs for customers.


Valuation Opportunity: Cash Flow Suggests Undervaluation

If NVIDIA generates $130 billion in annual free cash flow within the next 2–3 years, even a conservative valuation multiple of 30x FCF would imply:

Potential future valuation:

$130B × 30 = $3.9 trillion market cap

Compared to today’s lower valuation levels, this represents substantial upside potential.


Long-Term Investment Thesis: Why NVIDIA Remains a Buy

Key bullish factors:

1. AI Demand Is Still in Early Stages
Global AI adoption is accelerating, not slowing.

2. Massive Free Cash Flow Generation
Few companies in history have generated cash flow at NVIDIA’s scale.

3. Dominant Market Position
NVIDIA remains the undisputed leader in AI computing infrastructure.

4. Strong Shareholder Returns
The company has already returned $37 billion to shareholders through buybacks and dividends in FY2026 alone.

5. Long-Term Secular Tailwind
AI is expected to reshape every industry over the next decade.


Risks Investors Should Monitor

No investment is risk-free. Key risks include:

  • Increased competition from AMD, Broadcom, and hyperscalers
  • Government export restrictions
  • Potential slowdown in hyperscaler spending
  • Valuation volatility due to macroeconomic conditions

However, none of these risks currently undermine NVIDIA’s dominant position.


Conclusion: Suppressed Prices May Represent a Rare Opportunity

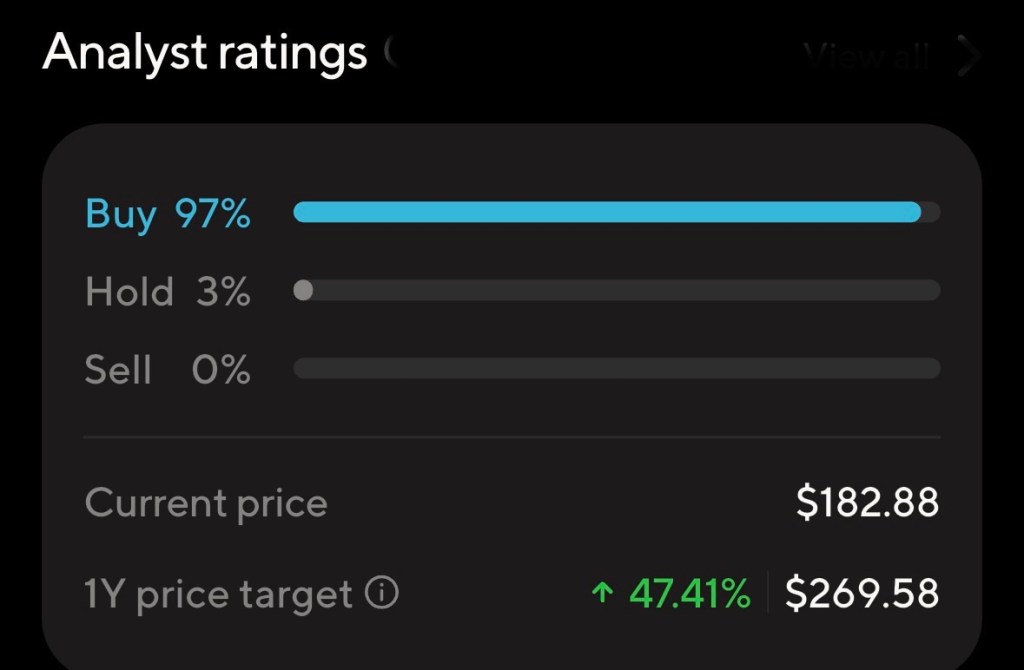
NVIDIA remains one of the most financially powerful and strategically positioned companies in the world. Despite short-term stock volatility, its explosive revenue growth, dominant AI position, and unprecedented free cash flow generation suggest that current price consolidation may represent one of the most attractive long-term entry opportunities available.

For investors with a multi-year horizon, NVIDIA remains a cornerstone asset in the AI-driven future economy.


Disclosure:
The author does not currently own, directly or indirectly, any shares, options, or other financial interests in NVIDIA Corporation (NASDAQ: NVDA) at the time of publication. This article is provided for informational and educational purposes only and does not constitute financial, investment, or trading advice. Investors should conduct their own research and consult with a licensed financial professional before making any investment decisions.

References

Barron’s. (2026, February). Nvidia stock rises. Broadcom is closing the AI chips gap. Retrieved from https://www.barrons.com

Barron’s. (2026, February). Nvidia stock pops. It should benefit from OpenAI spending. Retrieved from https://www.barrons.com

MarketWatch. (2026, February). Microsoft’s stock is cheaper than IBM’s for the first time in a decade. Retrieved from https://www.marketwatch.com

NVIDIA Corporation. (2025). NVIDIA announces financial results for fourth quarter and fiscal 2025. Retrieved from https://nvidianews.nvidia.com

NVIDIA Corporation. (2025). NVIDIA announces financial results for second quarter fiscal 2026. Retrieved from https://nvidianews.nvidia.com

NVIDIA Corporation. (2025). NVIDIA announces financial results for third quarter fiscal 2026. Retrieved from https://nvidianews.nvidia.com

NVIDIA Corporation. (2025). NVIDIA announces financial results for first quarter fiscal 2026. Retrieved from https://nvidianews.nvidia.com

Tom’s Hardware. (2025, December). Nvidia’s revenue skyrockets to record $57 billion per quarter. Retrieved from https://www.tomshardware.com


Getting Started with ETFs: The Ideal Investment for Beginners

For individuals entering the investment world, the sheer volume of choices like individual stocks, bonds, options, commodities, and more can feel overwhelming. Exchange-Traded Funds, commonly known as ETFs, have emerged as one of the most practical and efficient starting points for new investors. By combining diversification, accessibility, and flexibility, ETFs offer exposure to broad segments of the market while minimizing many of the risks associated with selecting individual securities.

Yet while ETFs are powerful tools, they are not a cure-all. Understanding both their capabilities and limitations is essential before incorporating them into a long-term investment strategy.


What Is an ETF?

An Exchange-Traded Fund is a pooled investment vehicle that trades on a stock exchange, much like an individual stock. Each ETF holds a basket of underlying assets such as stocks, bonds, commodities, or other securities. When you purchase one share of an ETF, you are effectively purchasing partial ownership in all the assets within that fund.

For example:

  • An S&P 500 ETF provides exposure to 500 of the largest U.S. companies.
  • A bond ETF provides exposure to government or corporate debt.
  • A sector ETF might focus solely on technology, healthcare, or energy.

This structure allows investors to diversify their portfolio instantly with a single transaction.


Why ETFs Are an Ideal Starting Point for Beginners

1. Instant Diversification

One of the biggest risks new investors face is concentration risk putting too much money into a single stock. ETFs mitigate this by spreading investments across dozens, hundreds, or even thousands of securities.

Instead of betting on one company, you can invest in an entire market segment.

2. Lower Costs Compared to Mutual Funds

Most ETFs are passively managed, meaning they track an index rather than relying on expensive active management. As a result, expense ratios are typically very low—often under 0.10% annually.

Lower fees translate into higher long-term returns, as fees compound negatively over time.

3. Ease of Trading

ETFs trade throughout the day on stock exchanges, just like individual stocks. Investors can buy or sell at any time during market hours, providing flexibility and liquidity.

4. Transparency

Most ETFs disclose their holdings daily, allowing investors to see exactly what they own. This transparency helps investors make informed decisions.

5. Accessibility

Many brokerage platforms allow investors to purchase ETFs with no commissions and relatively small amounts of capital.


Chart: Trade Opportunities Available Through ETFs

Trade OpportunityETF Example TypeRisk LevelPotential RewardBest For
Broad Market ExposureS&P 500 ETFModerateSteady long-term growthBeginners, retirement investors
Sector InvestingTechnology or Healthcare ETFModerate-HighHigher growth potentialInvestors targeting specific industries
Dividend IncomeDividend ETFLow-ModeratePassive income + growthIncome-focused investors
Bond ExposureTreasury or Corporate Bond ETFLowStability and incomeConservative investors
International MarketsEmerging Markets ETFHighHigh growth potentialDiversification seekers
Commodity ExposureGold or Oil ETFHighInflation hedgeAdvanced diversification
Thematic InvestingAI, Clean Energy ETFHighSignificant upside potentialGrowth-oriented investors
Defensive InvestingConsumer Staples ETFLow-ModerateStability during downturnsRisk-averse investors

What ETFs Can Do for You

Provide Diversification Efficiently

ETFs allow investors to spread risk across multiple companies and sectors without needing large amounts of capital.

Reduce Emotional Decision-Making

Instead of worrying about individual company performance, ETFs allow investors to focus on broader economic trends.

Build a Strong Long-Term Foundation

Many retirement portfolios are built primarily using broad-market ETFs due to their consistency and reliability.

Offer Exposure to Specialized Markets

ETFs make it possible to invest in areas that would otherwise be difficult to access, such as foreign markets, commodities, or niche sectors.


What ETFs Cannot Do for You

Guarantee Profits

ETFs follow the market. If the overall market declines, ETFs will decline as well.

Eliminate Risk

While diversification reduces risk, it does not eliminate it. Market downturns affect most ETFs.

Outperform the Market Consistently

Most ETFs are designed to match market performance, not exceed it.

Protect Against Poor Investment Timing

Buying during market highs can still lead to temporary losses, even with diversified ETFs.


ETFs vs Individual Stocks: Risk Comparison

FeatureETFsIndividual Stocks
DiversificationHighLow
Risk LevelModerateHigh
VolatilityLowerHigher
Research RequiredModerateHigh
Potential RewardModerate-HighHigh
Loss PotentialReducedSignificant

Why Many Professionals Recommend ETFs First

Warren Buffett, one of the most successful investors in history, has repeatedly recommended low-cost index ETFs for most investors. His reasoning is simple: consistently beating the market is extremely difficult, even for professionals.

ETFs allow investors to participate in overall economic growth without needing to predict which individual companies will succeed.


The Bottom Line

Exchange-Traded Funds represent one of the most efficient and accessible tools available to new investors. They offer instant diversification, low costs, transparency, and flexibility—making them an ideal starting point for building wealth.

However, investors must understand that ETFs are not risk-free. They reflect the performance of the underlying markets, meaning patience, discipline, and long-term thinking remain essential.

For those beginning their investment journey, ETFs provide something invaluable: a balanced and intelligent way to participate in the market while learning and growing as an investor.

Over time, they can serve not just as a starting point but as the foundation of a successful financial future.

References

Buffett, W. E. (2017). The essays of Warren Buffett: Lessons for corporate America (5th ed.). Carolina Academic Press.

Investment Company Institute. (2024). 2024 investment company fact book. https://www.ici.org

Morningstar, Inc. (2025). ETF investing guide: Understanding exchange-traded funds. https://www.morningstar.com

Securities and Exchange Commission. (2023). Exchange-traded funds (ETFs). U.S. Securities and Exchange Commission. https://www.sec.gov

U.S. Securities and Exchange Commission. (2024). Beginner’s guide to asset allocation, diversification, and rebalancing. https://www.investor.gov

Vanguard Group. (2024). Understanding ETFs: Benefits and risks. Vanguard. https://www.vanguard.com

BlackRock. (2025). ETF basics: What is an ETF? iShares by BlackRock. https://www.ishares.com

Bonds Are Back: From Portfolio Stabilizer to Income and Opportunity Engine

For much of the past decade, bonds were viewed primarily as a defensive allocation useful for dampening volatility, but rarely exciting. With historically low yields following the Global Financial Crisis and through the pandemic era, investors increasingly turned toward equities for meaningful returns while bonds played a passive role as a stabilizer.

That narrative is now changing. Bonds are once again emerging not only as a ballast for portfolios but as a legitimate source of income, total return potential, and tactical opportunity particularly for investors who understand how to position themselves across the yield curve.

The Great Reset: Higher Yields Have Changed the Equation

The most important development driving renewed interest in bonds is simple: yields are materially higher than they were just a few years ago.

Following aggressive Federal Reserve rate hikes between 2022 and 2024 to combat inflation, interest rates across maturities reset to levels not seen in over 15 years. As a result:

  • Short-term U.S. Treasury yields have hovered between 4.0% and 5.0%
  • Intermediate-term Treasuries offer yields in the 3.8% to 4.5% range
  • Investment-grade corporate bonds often yield 4.5% to 6.0%
  • Select high-quality municipal bonds provide tax-equivalent yields exceeding 6% for high-income investors

This shift represents a structural change. Investors can now generate meaningful income from bonds without assuming excessive credit risk or volatility.

For retirees, income-focused investors, and balanced portfolio managers, this is a significant opportunity.

Understanding the Yield Curve: Opportunity Lies in Positioning

The yield curve which plots interest rates across different maturities has been unusually dynamic in recent years. In some periods, shorter-term bonds have yielded more than longer-term bonds, creating what is known as an inverted yield curve, often associated with economic transitions.

This environment creates multiple strategic options.

Short-Term Bonds: High Income, Low Duration Risk

Short-term bonds (1–3 years maturity) currently offer attractive yields with minimal sensitivity to interest rate changes. This makes them ideal for:

  • Conservative investors
  • Cash alternatives
  • Capital preservation with income

They provide flexibility, allowing investors to reinvest at higher rates if yields rise further.

Intermediate-Term Bonds: The “Sweet Spot”

Many professional portfolio managers consider the intermediate portion of the yield curve (3–7 years) to offer the best balance of income and risk.

These bonds:

  • Provide strong yields
  • Offer moderate duration exposure
  • Stand to benefit if interest rates decline in the future

If rates fall, intermediate bonds may appreciate in price, delivering both income and capital gains.

Long-Term Bonds: Strategic Opportunity for Rate Declines

Long-duration bonds (10+ years) are more sensitive to interest rate movements but offer significant upside potential if interest rates decline.

When rates fall:

  • Bond prices rise
  • Longer-duration bonds rise more dramatically

This creates potential total return opportunities beyond income alone.

Bonds Are Once Again Competing with Stocks

One of the most important implications of higher yields is that bonds are now competitive with equities from an income perspective.

Consider this comparison:

  • S&P 500 dividend yield: approximately 1.5%
  • Investment-grade bonds: 4.5% to 6.0% yield
  • Treasury bonds: 3.8% to 4.5% yield

For the first time in many years, bonds offer substantially higher income with lower volatility.

This improves the risk-return tradeoff of balanced portfolios.

Portfolio Implications: A Strategic Shift Back Toward Fixed Income

Financial professionals increasingly recommend a renewed allocation to bonds—not just for safety, but for income generation and opportunity capture.

Thoughtful positioning across maturities can provide three simultaneous benefits:

1. Reliable Income Stream

Higher yields allow investors to generate consistent income without relying solely on dividends or equity appreciation.

2. Capital Appreciation Potential

If interest rates decline in the next 12–36 months, as many economists expect bond prices may rise, providing total return potential.

3. Risk Diversification

Bonds help reduce portfolio volatility and provide protection during equity market downturns.

Recommended Portfolio Framework: Laddered and Diversified

Rather than concentrating exposure in a single maturity, many advisors recommend a laddered bond strategy, which distributes investments across multiple maturities.

A sample framework may include:

  • 30% Short-Term Bonds (1–3 years)
    Provides stability and reinvestment flexibility
  • 40% Intermediate-Term Bonds (3–7 years)
    Offers strong income and balanced rate sensitivity
  • 20% Long-Term Bonds (7–20 years)
    Positions portfolio for capital appreciation if rates decline
  • 10% Opportunistic Credit (Investment-grade corporates or municipals)
    Enhances yield without excessive risk

This structure balances income, stability, and growth potential.

The Role of Bonds in 2026 and Beyond

The bond market is no longer an afterthought. It has returned to its traditional role as both a defensive and offensive component of a well-constructed portfolio.

Investors who actively position across the yield curve can benefit from:

  • Elevated income levels
  • Potential capital gains from future rate declines
  • Improved diversification and portfolio stability

After years of offering limited returns, bonds are once again doing what they were always meant to do: generate income, preserve capital, and create opportunity.

For disciplined investors, this is not merely a defensive allocation… it is a strategic advantage.

References

Board of Governors of the Federal Reserve System. (2026). Selected interest rates (daily) – H.15 release. https://www.federalreserve.gov/releases/h15/

U.S. Department of the Treasury. (2026). Daily treasury yield curve rates. https://home.treasury.gov/resource-center/data-chart-center/interest-rates

Federal Reserve Bank of St. Louis. (2026). 10-year treasury constant maturity rate (DGS10). FRED Economic Data. https://fred.stlouisfed.org/series/DGS10

U.S. Securities and Exchange Commission. (2024). Investor bulletin: Bonds. https://www.sec.gov/resources-for-investors/investor-alerts-bulletins/investor-bulletin-bonds

Morningstar, Inc. (2026). Fixed-income outlook and bond market commentary. https://www.morningstar.com

S&P Dow Jones Indices. (2026). S&P 500 dividend yield and index characteristics. https://www.spglobal.com/spdji/en/indices/equity/sp-500/

Vanguard Group. (2026). Economic and market outlook: Fixed income perspectives. https://investor.vanguard.com/investment-products/fixed-income

BlackRock. (2026). Global fixed income outlook. https://www.blackrock.com/institutions/en-us/insights/fixed-income

Conagra Brands ($CAG): High Dividend Yield and Depressed Valuation Create a Compelling Income Opportunity

February 7, 2026

Conagra Brands, Inc. (NYSE: CAG), one of America’s largest packaged food companies and owner of iconic brands such as Birds Eye, Slim Jim, Healthy Choice, and Marie Callender’s, has emerged as a compelling investment candidate for income-focused investors. Despite recent operational challenges and declining share price performance, the company’s unusually high dividend yield, stable cash flows, and historically low valuation may present an attractive risk-reward profile for long-term investors willing to tolerate near-term volatility.


Current Stock Price and Market Position

As of early February 2026, Conagra Brands shares are trading at approximately $19.55 per share, near the lower end of their 52-week range of $15.96 to $28.52. The company currently carries a market capitalization of roughly $8.8–$8.9 billion and generates annual revenue of approximately $11.23 billion, underscoring its significant presence in the consumer staples sector.

However, the stock has declined more than 26% over the past year, reflecting investor concerns about declining sales volume, rising costs, and shifting consumer preferences.

While these headwinds have weighed on investor sentiment, they have also created a rare combination of depressed valuation and elevated income potential.


Dividend Yield: A Major Strength for Income Investors

Conagra Brands’ most compelling investment characteristic is its dividend.

  • Annual dividend: $1.40 per share
  • Dividend yield: Approximately 7.16% to 7.89% depending on price fluctuations
  • Dividend payout frequency: Quarterly
  • Dividend history: Over 160 dividend payments since 1985

This yield is significantly higher than the broader S&P 500 average, which typically ranges between 1.5% and 2.0%.

Even more importantly, Conagra generates strong free cash flow—approximately $1.14 billion annually—which supports its dividend payments and enhances their sustainability.

The company’s dividend payout ratio based on forward estimates ranges between 45% and 59% of cash flow, indicating the dividend is supported by underlying earnings power rather than excessive borrowing.

For investors seeking income, this dividend alone provides substantial annual returns regardless of stock price appreciation.


Valuation: Historically Low Price Creates Opportunity

One of the most compelling reasons investors may consider Conagra today is its relatively low valuation.

Key valuation metrics include:

  • Forward price-to-earnings ratio: Approximately 10.4
  • Free cash flow yield: 13.4%
  • Book value per share: $18.64 (close to current share price)

These metrics suggest the stock is trading near its intrinsic asset value, with investors effectively paying a modest premium for a business that generates over $1 billion annually in free cash flow.

Historically, consumer staples companies trade at higher multiples due to their predictable cash flows and defensive characteristics. A forward P/E ratio near 10 places Conagra at a meaningful discount compared to many peers.


Cash Flow and Financial Strength Support Long-Term Stability

Despite near-term earnings pressures, Conagra remains fundamentally profitable and cash-generating.

Financial highlights include:

  • Operating cash flow: $1.54 billion annually
  • Free cash flow: $1.14 billion annually
  • Gross margin: 25.5%
  • Operating margin: 13.83%

These metrics demonstrate that even in a challenging economic environment, Conagra continues to generate meaningful profit margins.

Consumer staples companies like Conagra also tend to be more resilient during economic downturns, as demand for packaged food remains relatively stable regardless of broader economic conditions.


Recent Challenges Have Created Opportunity

Recent operational challenges have contributed to the stock’s decline, including:

  • Volume declines due to inflation-sensitive consumers
  • Rising raw material costs, particularly meat prices
  • Impairment charges and slower growth expectations

However, these challenges appear cyclical rather than structural.

Importantly, Conagra has reaffirmed its long-term outlook and continues investing in efficiency improvements, pricing strategies, and portfolio optimization.


Analyst Price Target and Future Outlook

Wall Street analysts currently maintain an average price target of approximately $20.58, representing potential upside of about 16% from current levels.

Even more conservative targets suggest modest appreciation potential, while income investors collect a substantial dividend while waiting.

Reasonable 12-Month Price Projection

Based on:

  • Historical valuation multiples
  • Dividend yield normalization
  • Improving cost pressures
  • Stable consumer demand

A realistic one-year price range for Conagra Brands is:

Base Case: $20–$23
Bull Case: $24–$26
Bear Case: $17–$19

In addition to capital appreciation, investors could receive approximately 7% annual income, significantly enhancing total returns.


Total Return Potential: Combining Dividend and Price Recovery

If shares rise from $19.55 to $22.50 over the next year:

  • Capital gain: ~15%
  • Dividend yield: ~7%
  • Total return potential: ~22%

This level of total return potential is unusually high for a defensive consumer staples company.


Why Conagra Brands May Be a Strong Investment Choice

Key investment strengths include:

1. Exceptionally High Dividend Yield
Nearly 7–8%, far above market averages.

2. Strong Cash Flow Generation
Over $1 billion annually supports dividend sustainability.

3. Low Valuation Relative to Cash Flow and Assets
Forward P/E near 10 suggests undervaluation.

4. Defensive Industry Position
Food companies benefit from consistent consumer demand.

5. Potential Price Recovery as Conditions Improve
Even modest improvement could drive meaningful upside.


Investment Risks

Despite its strengths, investors should consider potential risks:

  • High debt levels (~$8.28 billion)
  • Slowing revenue growth
  • Inflation and commodity cost pressures
  • Changing consumer dietary preferences

These risks explain the stock’s depressed valuation but also contribute to its opportunity.


Conclusion: Attractive Income Play with Recovery Potential

Conagra Brands represents a classic high-yield, undervalued income stock. While recent operational challenges have pushed shares lower, the company continues generating strong cash flow and paying a highly attractive dividend.

For income-focused investors and those seeking undervalued defensive stocks, Conagra offers:

  • Strong income potential
  • Possible capital appreciation
  • Defensive consumer staples exposure

If operational performance stabilizes and investor sentiment improves, Conagra Brands could deliver both income and moderate capital gains over the coming year.


Disclosure

The author currently holds a position in Conagra Brands (CAG). This article is for informational purposes only and should not be considered financial advice. Investors should conduct their own research or consult a financial advisor before making investment decisions.


References

StockAnalysis.com. (2026). Conagra Brands stock statistics and valuation. Retrieved from https://stockanalysis.com/stocks/cag/statistics/

StockAnalysis.com. (2026). Conagra Brands dividend information. Retrieved from https://stockanalysis.com/stocks/cag/dividend/

StockAnalysis.com. (2026). Conagra Brands stock overview. Retrieved from https://stockanalysis.com/stocks/cag/

CompaniesMarketCap.com. (2026). Conagra Brands dividend yield and market cap. Retrieved from https://companiesmarketcap.com/conagra-brands/dividend-yield/

CompaniesMarketCap.com. (2026). Conagra Brands dividend history. Retrieved from https://companiesmarketcap.com/conagra-brands/dividends/

MarketBeat.com. (2026). Conagra Brands dividend payout ratio and yield analysis. Retrieved from https://www.marketbeat.com

Reuters. (2025). Conagra maintains forecasts amid subdued demand. Retrieved from https://www.reuters.com

Barron’s. (2025). Conagra downgraded due to rising meat prices. Retrieved from https://www.barrons.com

ServiceNow Navigates Market Volatility With Strong Fundamentals and AI Momentum

ServiceNow, Inc. (NYSE: NOW), the enterprise workflow automation and AI-driven software company, is attracting renewed investor attention as it enters its next earnings period with mixed signals from the market. After a prolonged sell-off in 2025 and early 2026, shares have shown signs of stabilization ahead of quarterly results due this week, while analysts revise forecasts on both the upside and downside.

Market Context:
As of the most recent close, ServiceNow’s stock price finished at $133.11, up 3.5% on positive sentiment ahead of earnings week. (TechStock²) The company’s shares have experienced significant pressure over the past year, falling roughly 30–50 percent from prior highs, signaling broader investor caution within the enterprise software sector. (TradingView+1)


Recent Financial Performance

ServiceNow’s underlying financial performance remains robust despite stock price challenges:

MetricMost Recent Reported
Q3 2025 Revenue$3.407 billion (+22% YoY) (GuruFocus)
Subscription Revenue$3.299 billion (+21.5% YoY) (GuruFocus)
Q3 2025 EPS$2.40 (beats expectations) (GuruFocus)
Q2 2025 Subscription Revenue$3.113 billion (+22.5% YoY) (ServiceNow Investor Relations)
Performance Obligations (RPO)$23.9 billion (+29% YoY) (ServiceNow Investor Relations)

ServiceNow also continues to expand its customer base, with strong demand in large enterprises and sustained growth in contract value obligations. (ServiceNow Investor Relations)

Financial Chart (Selected Historical & Forecast Data):

Metric / Timeframe2024 Actual2025 ActualAnalyst 2026 Avg Target
Revenue Growth~21% YoY~22% YoY— (Estimated Stable Growth)
Stock Price (Year-End)~$239.62 (52-wk high) (MarketWatch)~$128–134 range (MarketWatch)Consensus ~ $209.07 Avg (MarketBeat)
Analyst Price Target Range$170–$263 (TipRanks)Consensus Moderate Buy$209.07 Average 12-mo (MarketBeat)

Catalysts and Risks

Positive Drivers:

  • AI Integration and Partnerships: The company’s strategic deployment of AI capabilities particularly through deepening enterprise AI products and partnerships positions it within one of the fastest-growing segments of enterprise software. (The Wall Street Journal)
  • Earnings Beats: Recent quarters have seen revenue and EPS exceed consensus estimates, reinforcing the company’s pricing power and durability even in more cautious macro environments. (Nasdaq)
  • Stock Split Authorization: A board-approved 5-for-1 stock split aims to improve liquidity and broaden retail investor ownership. (Yahoo Finance)

Challenges:

  • Valuation Compression: Analysts have trimmed price targets in light of broader software sector rotation, leading to downward revisions that reflect caution ahead of earnings and uncertain macro conditions. (Ad Hoc News)
  • Market Sentiment: Software stocks broadly have underperformed amid shifting investor preferences toward semiconductors and AI infrastructure names, contributing to valuation pressure for ServiceNow. (Investopedia)

Analyst Forward Outlook & Stock Price Forecast (Next 12 Months)

Market forecasts reflect a moderate buy consensus for NOW with meaningful upside potential despite short-term volatility:

  • MarketBeat Consensus: Average 12-month price target of $209.07 — implying approximately 57% potential upside from current levels. (MarketBeat)
  • TipRanks Data: Average analyst target range of $170 to $263, with a “Strong Buy” consensus overall. (TipRanks)
  • Bullish Scenarios: Some analysts project further expansion toward historical peer valuations if growth and AI monetization accelerate. (TIKR.com)

Projected Price Range in One Year: $180–$250, contingent upon execution of AI initiatives, macro stability, and continued enterprise software demand.


Disclosure

I currently hold a position in ServiceNow (NYSE: NOW). This article is for informational purposes only and does not constitute financial advice. Investors should conduct independent research before making investment decisions.


References

Investing.com. (2025, October 30). Wells Fargo raises ServiceNow stock price target to $1,275 on higher estimates. Retrieved from Investing.com. Investing.com
MarketBeat. (2026). ServiceNow (NOW) Stock Forecast & Price Target. Retrieved from MarketBeat. MarketBeat
MarketWatch. (2026, January). ServiceNow Inc. stock data. Retrieved from MarketWatch. MarketWatch
TradingView/ Invezz. (2026). Here’s why the ServiceNow stock price is tanking. Retrieved from TradingView. TradingView
TechSite (TS2.Tech). (2026, January 24). ServiceNow stock price jumps 3.5% into earnings week. Retrieved from TS2.Tech. TechStock²
Tikr (2026). After a 31% fall in the last 12 months, can ServiceNow recover in 2026? Retrieved from Tikr. TIKR.com
WSJ. (2026). OpenAI and ServiceNow Strike Deal to Put AI Agents in Business Software. Retrieved from The Wall Street Journal. The Wall Street Journal
ServiceNow Investor Relations. (2025). ServiceNow Reports Second Quarter 2025 Financial Results. Retrieved from ServiceNow IR. ServiceNow Investor Relations
GuruFocus News. (2025, October 30). ServiceNow Inc (NOW) Q3 2025 Earnings: EPS of $2.40 Beats Estimates. Retrieved from GuruFocus. GuruFocus

The Baldwin Group (NASDAQ: BWIN) Strengthens Market Position Through Strategic Acquisitions and Growth Initiatives

January 15, 2026 – Tampa, FLThe Baldwin Group (NASDAQ: BWIN), a leading independent insurance brokerage and advisory firm, is making notable strides in expanding its national footprint through a series of strategic acquisitions and corporate actions, moves that have attracted investor interest and helped support recent gains in its stock price.

In the last several months, Baldwin has completed multiple significant transactions. The company finalized its acquisition of Obie, a Chicago-based embedded landlord insurance distribution platform that has delivered extraordinary revenue growth since 2021. Obie’s insurance technology and nationwide distribution capabilities are expected to strengthen Baldwin’s real estate investor solutions and support broader adoption of embedded insurance offerings. (Stock Titan)

Shortly after the Obie announcement in mid-January 2026, Baldwin’s stock experienced a noticeable uptick, with shares rising over 3.6% on acquisition news a clear sign of investor confidence in Baldwin’s growth strategy. (IndexBox)

In early 2026, Baldwin also completed the acquisition of Capstone Group, a full-service Philadelphia-area insurance brokerage firm. Capstone expands Baldwin’s regional reach and adds new capabilities in risk management, group health, and ancillary benefit lines further diversifying Baldwin’s portfolio of services. (Investing.com)

Perhaps most transformational is the company’s $1.026 billion merger with CAC Group, a specialty and middle-market insurance brokerage transaction completed in early January 2026. This strategic combination positions Baldwin among the largest independent insurance advisory platforms in the U.S., adding unparalleled specialty expertise in sectors like cyber, financial lines, construction, natural resources, and private equity. (Stock Titan+1)

Financially, Baldwin has shown consistent growth in revenue and organic expansion across reporting periods in 2025. Third-quarter results reported revenue growth of 8% and continued adjusted earnings momentum, even as the company navigates through net losses on a GAAP basis. (Business Wire)

According to recent stock data, BWIN’s share price has reflected both volatility and opportunity. As of mid-January 2026, BWIN shares traded near $25.48, with a 52-week range of approximately $21.26 to $47.15. Analysts maintain a mixed outlook, with a consensus price target higher than current levels but tempered by risks related to integration and profitability challenges. (StockAnalysis)

Capital and Debt Strategy
Alongside these strategic acquisitions, The Baldwin Group has successfully priced an incremental $600 million Term Loan B, which upsizes its existing credit facility and provides flexibility to fund acquisitions and refinance existing borrowings. This capital strategy supports Baldwin’s expansion while managing leverage levels that accompany rapid growth. (Stock Titan)

Investment Considerations and Risks
Investors considering exposure to BWIN should be aware that, while the company is scaling rapidly, it continues to report net losses on a GAAP basis and carries a significant debt load tied to its acquisition strategy. Meanwhile, adjusted performance metrics demonstrate improving profitability trends that could support future valuation performance if realized. (Baldwin+1)

Disclosure: I hold a position in The Baldwin Group (BWIN), and the views expressed above reflect only general observations of recent developments and publicly available data.


References

IndexBox. (2026, January 15). Baldwin Insurance Group stock rises on Obie acquisition news.
Stockanalysis.com. (2026). The Baldwin Insurance Group (BWIN) Stock Price & Overview.
Business Wire. (2025). The Baldwin Group announces fourth quarter and full year 2024 results.
Business Wire. (2025, November 4). The Baldwin Group announces third quarter 2025 results.
StockTitan. (2026, January). The Baldwin Group completes acquisition of Obie and Capstone Group.
BeyondSPX. (2026, January). Baldwin Group completes $1.026 billion merger with CAC Group.
StockTitan. (2024). The Baldwin Group announces successful pricing of $600 million incremental Term Loan B.