VICI Properties: A 6.8% Dividend, Real-Estate Cash Machine & a Potential Swing-Trade Opportunity

VICI Properties Is More Than a Casino REIT

When investors hear VICI Properties Inc. (NYSE: VICI), the first thing that usually comes to mind is Las Vegas and for good reason. VICI owns the real estate behind some of the most recognizable gaming and entertainment properties in the country, including Caesars Palace Las Vegas, MGM Grand and the Venetian Resort Las Vegas.

But describing VICI as simply a “casino REIT” undersells the company.

VICI is an experiential real-estate investment trust that owns 103 properties across the United States and Canada, including 63 gaming properties and 40 other experiential properties. Its portfolio encompasses approximately 130 million square feet, 66,000 hotel rooms and more than 700 restaurants, bars, nightclubs and sportsbooks.

The company’s business model is particularly attractive from a cash-flow perspective: VICI generally owns the real estate while experienced operators run the businesses. Those operators pay VICI rent through long-term triple-net leases, meaning the tenants generally assume responsibility for property-level expenses such as taxes, insurance and maintenance.

That structure gives VICI something investors should appreciate: relatively predictable recurring rental revenue without having to operate the casinos itself.

And at today’s share price, that cash-flow model is becoming increasingly interesting.

The Regent casino hotel complex beside the sea at dusk
The Regent casino resort glows beside landscaped lagoons and the sea at dusk.

The Stock Is Trading at a Significant Discount to Its 52-Week High

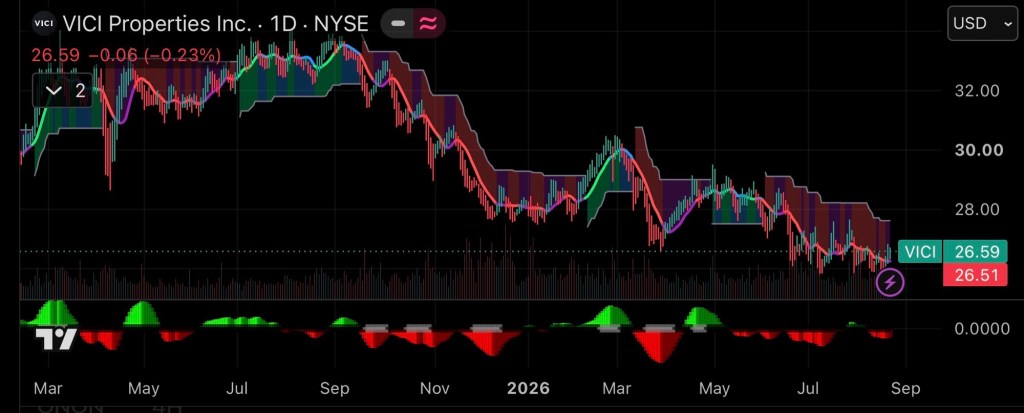
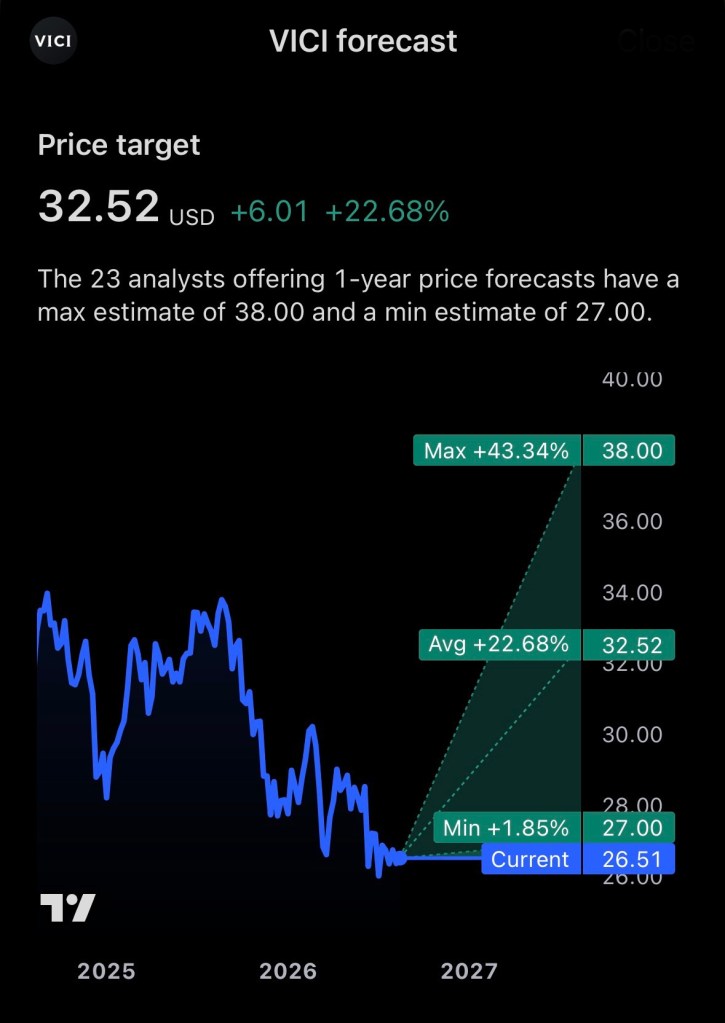
VICI closed around $26.51 on August 21, 2026, leaving the stock roughly 22% below its 52-week high of $33.92.

That decline is important because VICI’s underlying business has not collapsed.

Quite the opposite.

In its most recent quarter, VICI reported:

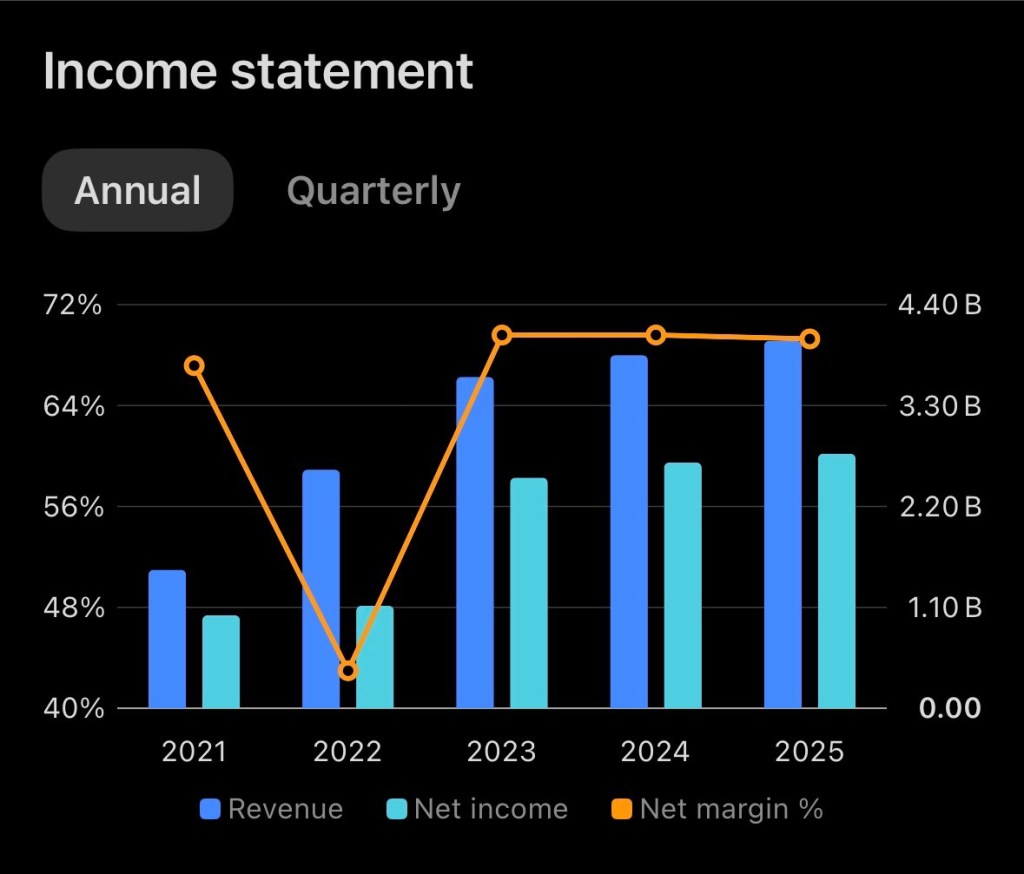
  • Revenue: approximately $1.1 billion, up 5.7% year over year
  • AFFO: $679.6 million, up 7.8%
  • AFFO per share: $0.62, up 4.6%
  • Full-year 2026 AFFO guidance: $2.45–$2.47 per share

AFFO- adjusted funds from operations is arguably the more important metric for a REIT investor because it provides a better picture of the recurring cash-generating capacity of the business than conventional GAAP earnings.

That distinction matters with VICI.

The company’s second-quarter GAAP net income fell sharply year over year, but management attributed much of the decline to a change in its non-cash credit-loss allowance. AFFO, meanwhile, increased.

In other words, the headline EPS number looks considerably worse than the underlying recurring cash-flow picture.
The Dividend Is the Big Attraction

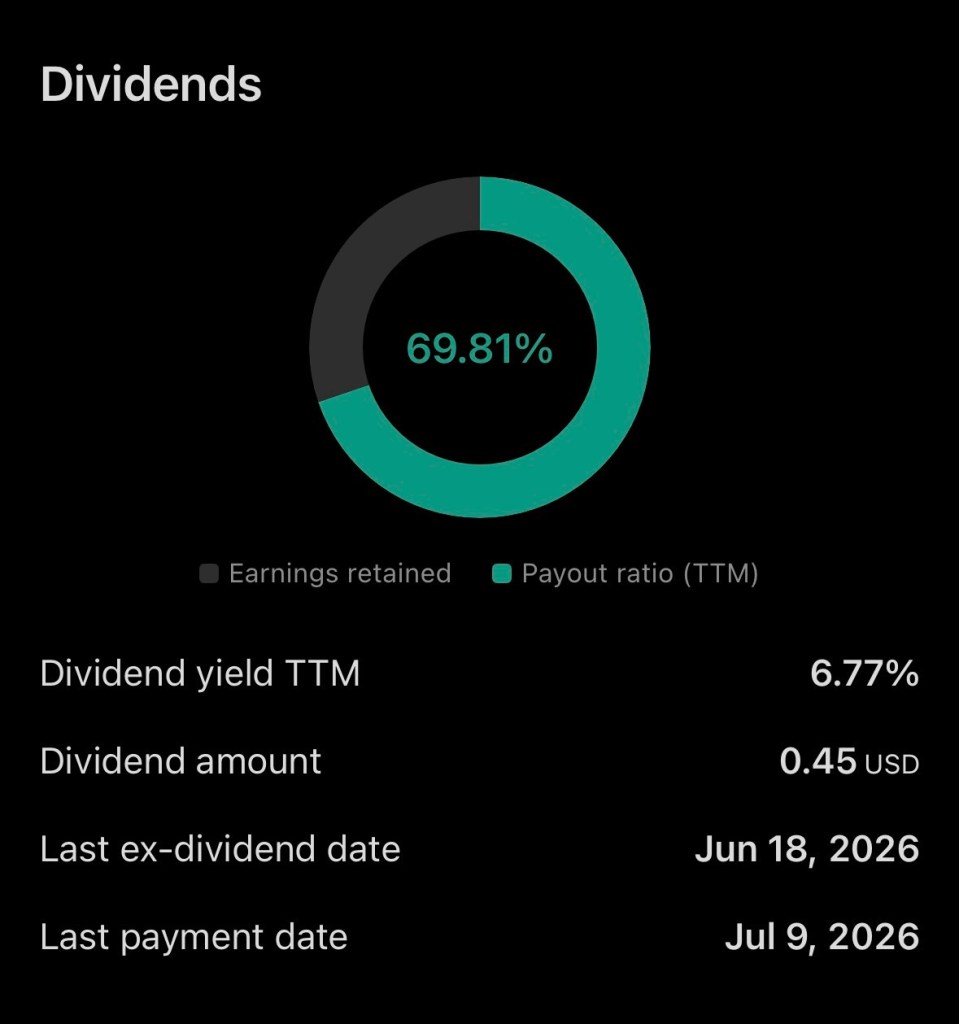
VICI currently pays a $0.45 quarterly dividend, or $1.80 annually if maintained at the current rate. The company has maintained the $0.45 quarterly payout through 2026.

At approximately $26.51 per share, that equates to a forward dividend yield of roughly:

$1.80 ÷ $26.51 = 6.79%

That’s a substantial yield for an S&P 500 company.

More importantly, VICI’s dividend has grown considerably since the company was formed. VICI’s annual dividend increased from $1.00 in 2018 to $1.77 in 2025, while the 2026 quarterly rate stands at $0.45.

Dividend Growth

YearAnnual Dividend
2018$1.00
2019$1.17
2020$1.26
2021$1.38
2022$1.50
2023$1.61
2024$1.70
2025$1.77
2026 annualized$1.80

Source: VICI Properties investor relations.

The growth rate has moderated as VICI has become larger, but the direction remains favorable.

Is the Dividend Covered?

This is where VICI gets particularly interesting.

Management’s 2026 AFFO guidance is $2.45–$2.47 per share. At a $1.80 annual dividend, the implied AFFO payout ratio is approximately 73%.

Using the midpoint of guidance:

$1.80 ÷ $2.46 = 73.2%

That leaves approximately 27% of AFFO per share above the current dividend.

For a REIT, that is a much more meaningful coverage measure than comparing the dividend with GAAP EPS.

It doesn’t mean the dividend is risk-free. VICI carries substantial debt, and REITs are particularly sensitive to interest rates and credit-market conditions. But the current payout appears reasonably supported by recurring AFFO.
VICI’s Growth Story Is Expanding Beyond Traditional Gaming

One of the more interesting aspects of VICI’s strategy is that management is trying to reduce the company’s dependence on traditional casino real estate.

During the second quarter, VICI added several important relationships.

The company welcomed Clairvest as its 14th tenant, Golden Entertainment as its 15th, and Club Med as its 16th tenant.

The Golden Entertainment transaction is particularly notable. VICI’s new Golden Entertainment Master Lease carries approximately $87 million in initial annual rent, a 30-year initial term and 2% annual rent escalators beginning in lease year three.

VICI also acquired the Carambola Beach Resort in St. Croix and plans to fund approximately $55.2 million of redevelopment through a build-to-suit arrangement with Club Med. The targeted reopening is in the fourth quarter of 2027.

That’s an important strategic development.

VICI isn’t abandoning gaming. Gaming remains its core competency.

But the company is increasingly attempting to become the landlord behind experiential destinations, including hospitality, wellness, golf and entertainment.

That potentially gives VICI a larger addressable market over time.

The Balance Sheet Is the Part Investors Should Watch

The biggest counterargument to the bullish VICI thesis is leverage.

As of June 30, 2026, VICI had approximately $17.2 billion of total debt and approximately $2.5 billion of liquidity, including cash and availability under its revolving credit facility.

That is not insignificant.

A REIT with substantial debt can perform very well when interest rates cooperate, but higher rates increase the cost of refinancing and can reduce the relative attractiveness of REIT yields compared with bonds and other fixed-income investments.

The good news is that VICI has continued to demonstrate access to capital and has been using interest-rate swaps to manage some future interest-rate exposure. As of June 30, the company had entered into $600 million of forward-starting interest-rate swaps.

The bad news is simple:

VICI doesn’t need a business crisis to underperform. Higher-for-longer interest rates alone can pressure the valuation.

That is one reason the stock can offer a nearly 7% yield while still trading at a discount to its previous highs.
What About a Swing Trade?

This is where VICI gets especially interesting.

VICI isn’t typically thought of as a swing-trading stock. It is a relatively mature REIT designed more for income and total return.

But that doesn’t mean it can’t be traded.

At approximately $26.51, the stock is sitting substantially below its prior $33.92 high.

Wall Street’s valuation suggests the market may have become too pessimistic. Current analyst estimates vary, but several consensus sources place the average 12-month target around $31–$33, with some targets as high as $38.

That creates an interesting setup.

A Potential Swing-Trade Framework

Entry zone: approximately $25.75–$26.50

Initial target: approximately $28.50–$30.00

Secondary target: approximately $31–$32.50

Bull-case target: approximately $33–$34

Risk-management level: roughly $24.50–$25.00, depending on the trader’s risk tolerance and confirmation of a breakdown.

These aren’t guaranteed support and resistance levels; they’re a framework based on the stock’s recent trading range, prior price behavior and current valuation.

The key technical question is whether VICI can establish a sustained move above the $27–$28 area.

If it can, the next move toward $30 becomes considerably more interesting.

If the stock instead loses the mid-$25 area on heavy volume, the swing-trade thesis weakens and investors should be prepared for another leg lower.
The Dividend Creates an Interesting Trading Dynamic

There’s another reason VICI is different from many swing trades.

A trader buying VICI isn’t simply betting on price appreciation.

At the current annualized dividend, an investor receives approximately 6.8% annualized income while waiting for the market to recognize the potential valuation opportunity.

For example, a hypothetical $10,000 investment at $26.51 would purchase approximately 377 shares.

At $1.80 per share annually, those shares would generate approximately:

$679 per year in dividends

before taxes, assuming the dividend remains unchanged.

If VICI subsequently rose from $26.51 to $30:

  • Capital gain: approximately $1,316
  • Annual dividend income: approximately $679
  • Potential combined one-year return: approximately $1,995, or roughly 20%

That’s not a forecast. It’s simply an illustration of why a high-yield REIT can offer an attractive total-return setup when bought at a depressed valuation.

The Risks Should Not Be Ignored

The bullish case is compelling, but VICI isn’t a risk-free 7% yield.

1. Interest-rate risk

REIT valuations can suffer when Treasury yields rise because investors demand a higher yield from real estate securities.

2. Leverage

Approximately $17.2 billion of debt means refinancing costs and credit-market conditions matter.

3. Tenant concentration

Although VICI is diversifying its tenant base, gaming remains central to the portfolio. The financial health of major operators remains important to VICI’s rent collection.

4. Gaming-cycle risk

Casino and entertainment spending is discretionary. A recession or deterioration in consumer spending could negatively affect tenants.

5. Regulatory risk

Gaming is heavily regulated. VICI’s tenants must maintain the necessary licenses and regulatory approvals to operate their properties.

6. Dividend-growth moderation

The dividend is attractive, but investors shouldn’t assume the double-digit dividend-growth rates VICI achieved earlier in its history will continue indefinitely.

VICI itself highlights interest rates, tenant credit risk, gaming-industry conditions, regulation, leverage and economic conditions among the factors that could materially affect future results.

My Take: VICI Looks More Interesting at $26.50 Than It Did at $34

At approximately $26.51, VICI presents an unusual combination:

A high-quality experiential real estate portfolio + long-term leases + growing AFFO + a nearly 7% dividend yield + a stock price more than 20% below its 52-week high.

The market is clearly demanding a risk premium.

And investors should understand why.

The company has significant debt, remains exposed to interest rates and still derives substantial economics from the gaming industry.

But the latest operating numbers don’t suggest a deteriorating business.

Second-quarter AFFO per share increased 4.6%, management raised the low end of its 2026 AFFO guidance, and the company continues to expand its tenant base and experiential real-estate footprint.

At $26.51, VICI trades at roughly 10.8 times the midpoint of management’s 2026 AFFO guidance.

That’s a valuation I find considerably more compelling than the stock’s previous $33–$34 range.

Bottom Line

For income investors: VICI’s approximately 6.8% yield and roughly 73% AFFO payout ratio make the stock worth serious consideration for a diversified income portfolio.

For value investors: The stock’s discount from its 52-week high combined with growing AFFO creates an attractive risk/reward profile if interest-rate pressures ease.

For swing traders: The $25.75–$26.50 area offers an intriguing entry zone, with $28.50–$30 representing a reasonable first profit-taking region and $31–$33 providing a larger upside target if momentum improves.

My overall view: VICI is more attractive as a buy-and-hold income/total-return position than as a pure short-term trade but the current valuation creates a legitimate swing-trade opportunity as well.

The most important catalyst to watch isn’t simply the next dividend.

It’s whether AFFO continues growing while interest-rate pressure on REIT valuations begins to fade.

If those two variables move in VICI’s favor, today’s $26–$27 price could eventually look like an attractive entry point in hindsight.


Investor Disclosure

Disclosure: I own a position in VICI Properties (VICI). This article reflects my personal analysis and is intended for informational and educational purposes only. It is not a recommendation to buy, sell or hold VICI or any other security. I may have a financial interest in the outcome of the analysis. Investors should conduct their own due diligence and consider their individual financial objectives, risk tolerance and investment horizon before making investment decisions.


References

MarketBeat. (2026, July 29). VICI Properties Inc. issues FY 2026 earnings guidance. MarketBeat source

MarketBeat. (2026). VICI Properties (VICI) stock forecast and price target 2026. MarketBeat analyst consensus

MarketScreener. (2026). VICI Properties, Inc.: Target price consensus and analysts recommendations. MarketScreener consensus data

U.S. Securities and Exchange Commission. (2026). VICI Properties Inc. and VICI Properties L.P. annual report on Form 10-K for the year ended December 31, 2025. SEC filing

VICI Properties Inc. (2026, February 25). VICI Properties Inc. announces fourth quarter and full year 2025 results. VICI Properties investor relations

VICI Properties Inc. (2026, July 29). VICI Properties Inc. announces second quarter 2026 results. VICI Properties second-quarter 2026 results

VICI Properties Inc. (2026). Dividends & tax information. VICI Properties dividend information

VICI Properties Inc. (2026). Historical price lookup. VICI Properties historical price data

CoreWeave (NASDAQ: CRWV): AI Infrastructure Powerhouse or High-Risk Growth Story?

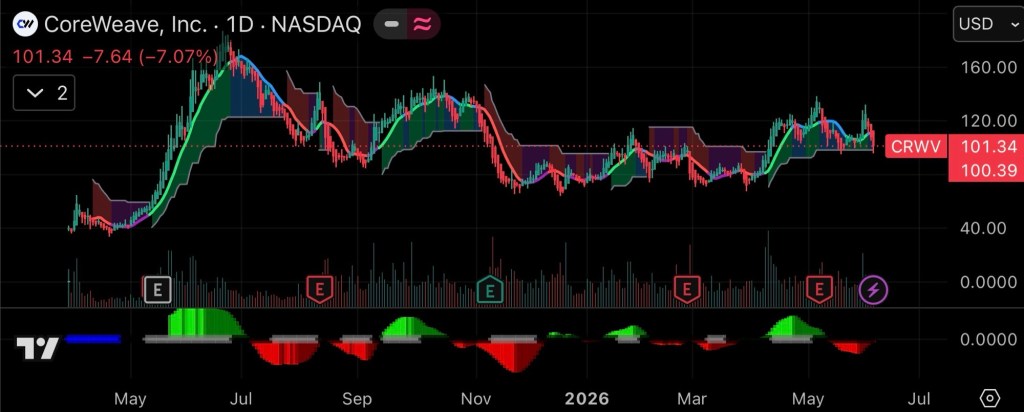
The artificial intelligence revolution has created a new generation of technology winners, and few companies have captured investor attention as quickly as CoreWeave (NASDAQ: CRWV). Since its public debut in 2025, CoreWeave has transformed from a niche cloud computing provider into one of the most closely watched AI infrastructure companies in the market.

As demand for artificial intelligence computing continues to accelerate, investors are asking a simple question: Does CoreWeave still have room to run?

Two technicians walking in a large data center with rows of illuminated AI server racks
Two technicians walk through a massive AI data center filled with illuminated server racks.

A Brief History of CoreWeave

CoreWeave was founded in 2017 and originally focused on cryptocurrency mining infrastructure. As demand for high-performance computing evolved, management pivoted toward providing specialized cloud infrastructure powered by NVIDIA graphics processing units (GPUs). That decision would prove transformational.

The company went public on the Nasdaq under the ticker CRWV in March 2025, pricing its initial public offering at $40 per share and raising approximately $1.5 billion to expand its AI cloud platform.

Since then, CoreWeave has become one of the leading providers of AI-focused cloud infrastructure, serving customers that require enormous amounts of computing power for training and operating large language models and other AI applications.

What’s Driving the Stock?

Several developments have fueled investor enthusiasm during 2026.

Most notably, CoreWeave became the first cloud provider to deploy NVIDIA’s new Vera Rubin NVL72 AI systems, reinforcing its position at the forefront of next-generation AI infrastructure. The announcement helped drive a significant rally in the stock and further strengthened the company’s strategic relationship with NVIDIA.

Earlier this year, NVIDIA expanded its partnership with CoreWeave and invested an additional $2 billion in the company. The two firms announced plans to accelerate the development of large-scale AI infrastructure and AI factories over the coming decade.

The company has also reported remarkable growth in customer demand. CoreWeave disclosed a revenue backlog of approximately $99.4 billion as of March 31, 2026, providing significant visibility into future revenue streams. Major customers include some of the largest names in artificial intelligence and cloud computing.

The Bull Case: Why Investors Remain Excited

Several factors support the bullish argument for CoreWeave.

Explosive AI Demand

Artificial intelligence remains one of the fastest-growing sectors in technology. Companies are racing to build increasingly sophisticated AI models, and all of them require massive amounts of computing power. CoreWeave’s infrastructure is specifically designed to meet that demand.

Strategic NVIDIA Relationship

Few companies have a closer relationship with NVIDIA than CoreWeave. Access to next-generation hardware before competitors could provide a significant advantage as AI workloads continue to grow.

Massive Revenue Backlog

A backlog approaching $100 billion gives investors confidence that demand remains strong despite concerns about the broader economy. Few newly public companies can point to this level of contracted business.

Industry Leadership

CoreWeave has established itself as one of the premier “AI-native” cloud providers. As enterprises increasingly adopt AI, the company may be positioned to capture a growing share of infrastructure spending.

The Bear Case: Risks Investors Should Consider

Despite its impressive growth, CoreWeave is not without risks.

Capital Intensive Business Model

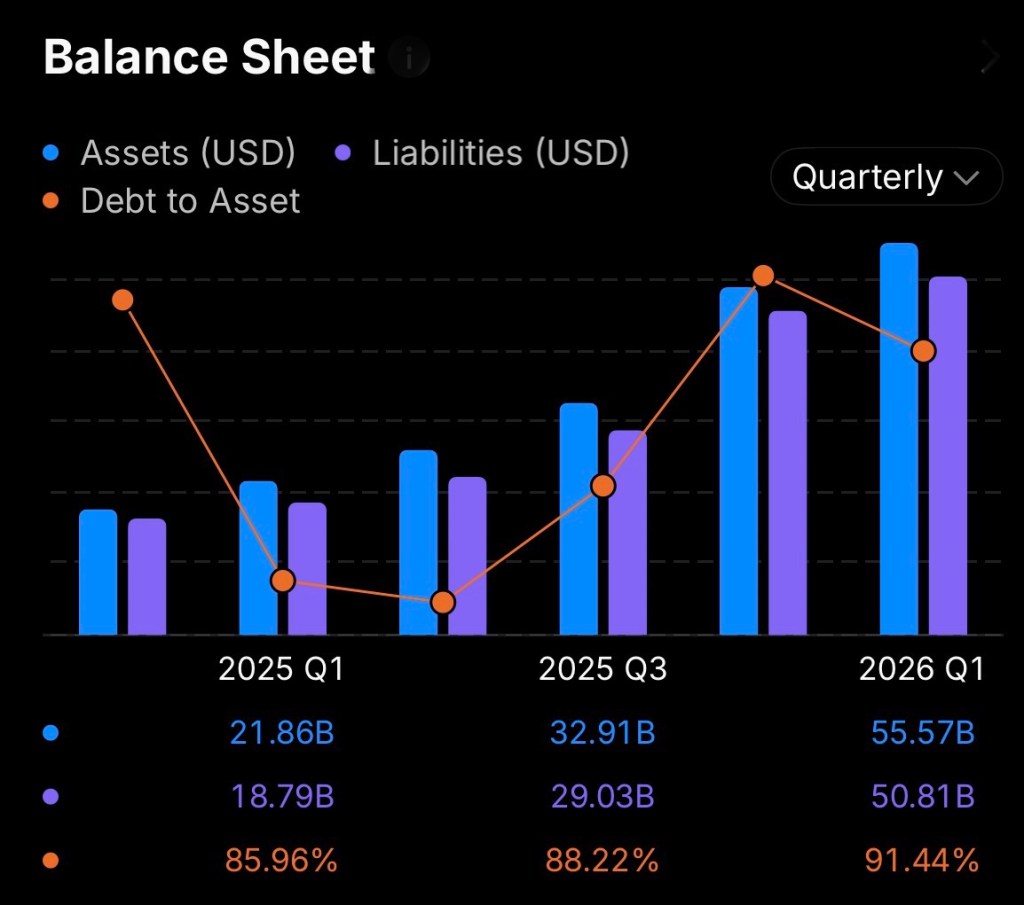
Building AI infrastructure is extraordinarily expensive. CoreWeave continues to spend billions on data centers, GPUs, and power capacity. Management recently increased its capital expenditure outlook as demand for AI hardware continues to surge.

Profitability Remains a Challenge

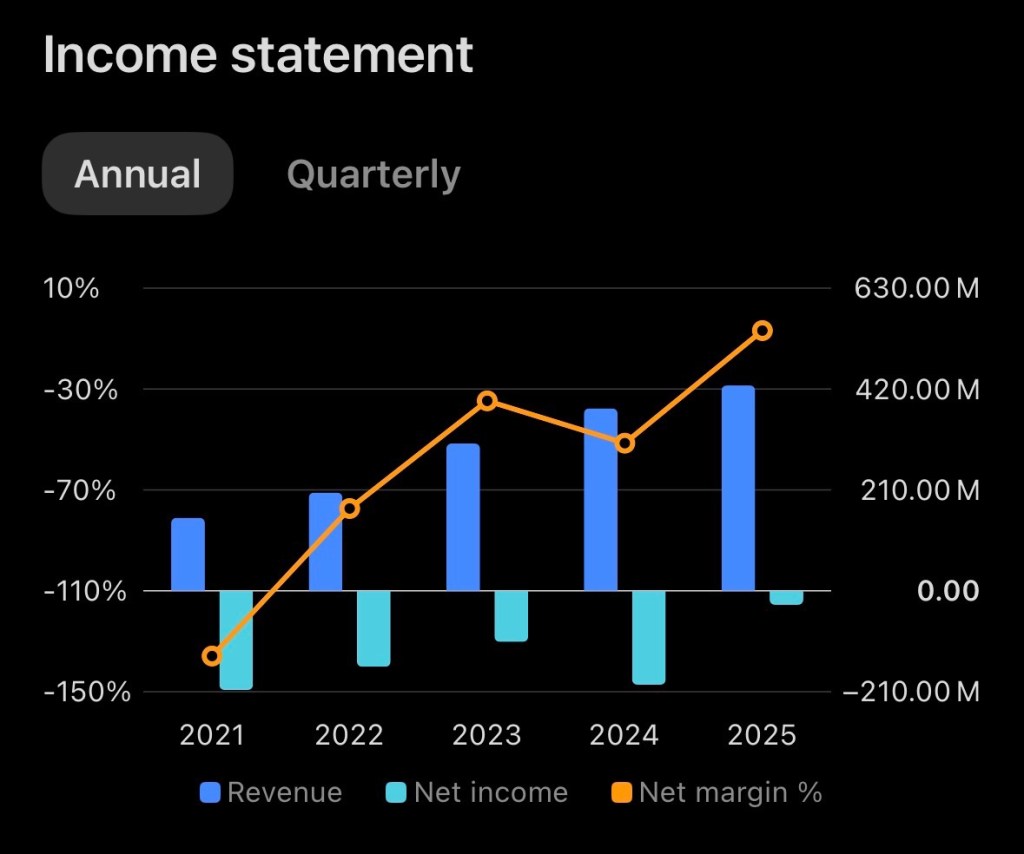
Although revenue growth has been exceptional, the company continues to report significant net losses. Investors are betting that future scale will eventually generate substantial profits. If growth slows before profitability improves, valuation concerns could emerge.

Customer Concentration

A meaningful portion of CoreWeave’s business comes from large AI companies and hyperscale cloud providers. Any reduction in spending from major customers could affect future growth rates.

Valuation Risk

Many AI-related companies trade at premium valuations based on expectations of future growth. If the AI spending cycle cools or investors become more cautious, high-growth stocks like CoreWeave could experience significant volatility.

Is There Still Upside Ahead?

The answer largely depends on whether investors believe AI infrastructure demand will continue expanding over the next decade.

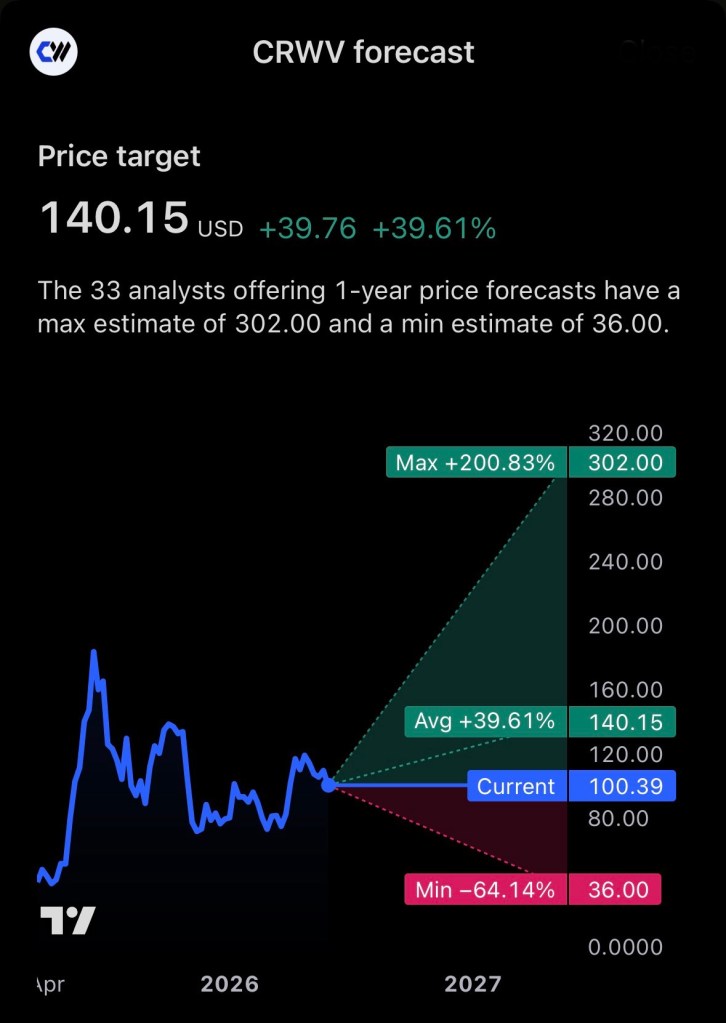
Supporters argue that artificial intelligence is still in its early innings and that the demand for compute power will continue to grow exponentially. If that thesis proves correct, CoreWeave could remain one of the primary beneficiaries of the AI buildout. Recent analyst targets and market commentary suggest many on Wall Street still see meaningful upside potential from current levels.

However, investors should recognize that CoreWeave remains a high-growth, high-risk company. The business must continue executing flawlessly while managing enormous capital expenditures and eventually demonstrating sustained profitability.

Bottom Line

CoreWeave has rapidly emerged as one of the most important infrastructure providers powering the AI revolution. The company’s strategic relationship with NVIDIA, enormous revenue backlog, and leadership position in AI cloud computing have helped fuel investor enthusiasm.

While the stock may continue to benefit from the expanding AI ecosystem, investors should remember that rapid growth often comes with substantial volatility. CoreWeave represents both the promise and the risks of investing in one of the market’s most exciting sectors.

For investors willing to tolerate uncertainty, CRWV remains one of the purest publicly traded plays on the future of artificial intelligence infrastructure.

Disclosure

The author owns shares of CoreWeave (NASDAQ: CRWV). This article is for informational and educational purposes only and should not be considered investment advice. Investors should conduct their own research and consult a qualified financial advisor before making investment decisions.

References

  1. CoreWeave. (2025, March 27). CoreWeave announces pricing of initial public offering. Retrieved from CoreWeave Investor Relations
  2. CoreWeave. (2026, May 7). CoreWeave reports strong first quarter 2026 results. Retrieved from CoreWeave Investor Relations
  3. CoreWeave. (2026). Investor relations overview. Retrieved from CoreWeave Investor Relations Overview
  4. NVIDIA. (2026, January 26). NVIDIA and CoreWeave strengthen collaboration to accelerate buildout of AI factories. Retrieved from NVIDIA Newsroom
  5. Reuters. (2026, May 7). CoreWeave signals higher capex as component costs rise, shares fall.
  6. Reuters. (2026, May 13). Nvidia CEO’s foundation buys $108 million of AI computing from CoreWeave, donates it to researchers.
  7. Barron’s. (2026, June 2). CoreWeave is first to offer NVIDIA’s newest AI system. The stock rises.
  8. Yahoo Finance. (2026). CoreWeave, Inc. (CRWV) stock price, news, quote & history. Retrieved from Yahoo Finance CRWV Page
  9. Stock Analysis. (2026). CoreWeave (CRWV) stock price & overview. Retrieved from Stock Analysis CRWV Overview
  10. MarketWatch. (2026, May 7). CoreWeave shares plunge. Revenue doubles but AI costs are rising.

Microvast Holdings ($MVST): A High-Risk Battery Bet With Global Ambitions

Microvast Holdings has become one of the more polarizing names in the electric vehicle and energy storage sector. Supporters view the company as an undervalued battery innovator with growing global manufacturing capacity, while critics point to volatile earnings, geopolitical concerns, and persistent financial risks.

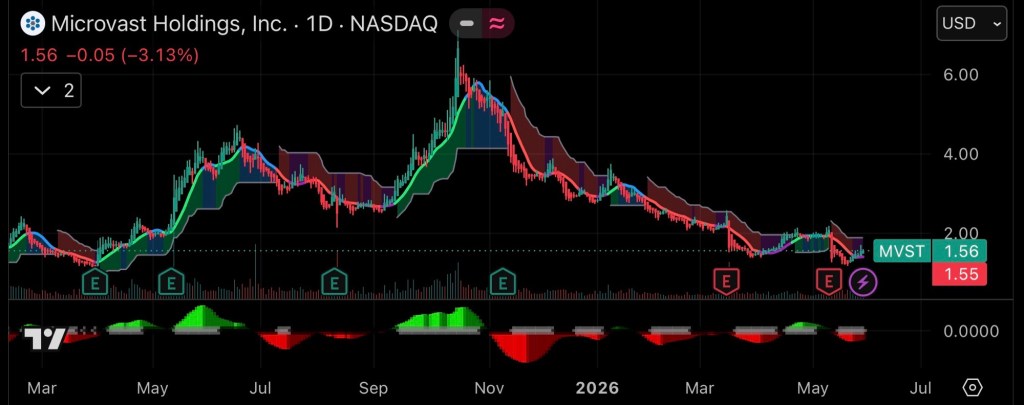
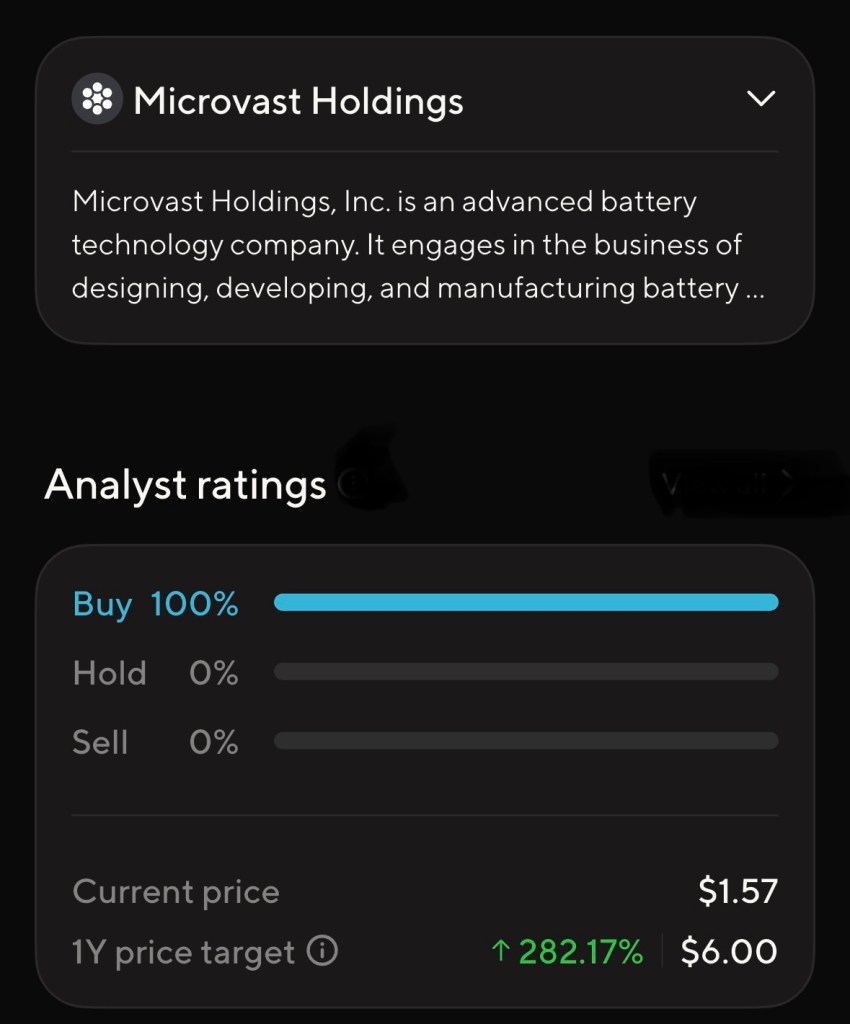
As of late May 2026, shares of MVST have traded near the low single digits after significant volatility over the last several years. Despite the sharp decline from post-SPAC highs, many investors continue to speculate that the company could benefit from the long-term expansion of electrification, commercial EV adoption, and energy storage demand.

Robotic assembly lines in a battery manufacturing plant with multiple blue robots and conveyor belts
A large automated factory floor producing battery modules

The History of Microvast

Founded in 2006 in Houston, Texas, Microvast focuses on lithium-ion battery systems for commercial vehicles, energy storage systems, and industrial applications. The company developed operations across the United States, China, and Germany while building expertise in battery chemistry, separators, electrolytes, and fast-charging systems.

The company gained broader investor attention in 2021 when it went public through a SPAC merger during the peak of EV enthusiasm. Like many SPAC-era companies, MVST initially traded at elevated valuations as investors aggressively pursued battery and clean-energy names.

Microvast later faced controversy surrounding its China operations and the cancellation of a proposed $200 million U.S. Department of Energy grant intended to support battery manufacturing expansion. That decision intensified investor concerns about geopolitical exposure and supply-chain dependency.

Still, the company continued expanding production capacity and investing in next-generation battery technologies. Management has emphasized commercial transportation markets rather than competing directly in the intensely competitive passenger EV battery space.

Current Financial Picture

Microvast’s recent financial results present a mixed picture.

For full-year 2025, the company reported record revenue of approximately $427.5 million, representing year-over-year growth of 12.6%. Gross margins improved materially, and losses narrowed significantly compared with prior years.

However, 2026 has started on a weaker note. In first-quarter 2026 results, revenue fell 48% year over year to $60.6 million due to regulatory pressures, geopolitical uncertainty, delayed OEM platform launches, and softer demand in certain international markets.

While the company remained GAAP profitable during the quarter because of accounting-related gains, adjusted earnings deteriorated sharply. Adjusted EBITDA turned negative, and the company disclosed ongoing operational headwinds tied to tariffs, logistics costs, and reduced factory utilization.

Balance sheet concerns also remain a factor. Some analysts continue monitoring debt levels and liquidity closely as the company works toward sustainable profitability.

Why MVST Could Be a Good Investment

Exposure to Long-Term EV and Energy Storage Growth

The global battery market is expected to expand substantially over the next decade as commercial transportation fleets, grid storage systems, and industrial electrification continue growing. Microvast already operates internationally and has established manufacturing infrastructure that could benefit if demand accelerates.

Vertical Integration

Unlike some battery competitors, Microvast develops multiple components internally, including cathodes, separators, and electrolytes. Investors bullish on the company believe this could improve margins and reduce dependence on third-party suppliers over time.

Improving Historical Revenue Trend

Although 2026 began weakly, revenue growth from 2022 through 2025 was substantial. Company reports show revenue more than doubling during that period while gross profit expanded meaningfully.

Commercial Vehicle Niche

Microvast focuses heavily on buses, industrial fleets, heavy equipment, and commercial transportation. Some investors believe this niche could prove more stable than the intensely competitive passenger EV market dominated by larger battery producers.

Why MVST Could Be a Poor Investment

Financial Volatility

The largest concern surrounding MVST remains inconsistent financial performance. Revenue swings, negative adjusted earnings, and ongoing cash burn have created significant uncertainty. The recent 48% quarterly revenue decline demonstrates how vulnerable the business remains to external disruptions.

Geopolitical Risk

Microvast’s operational footprint includes China, which continues generating political and regulatory concerns among some U.S. investors and policymakers. Tariffs, export controls, and shifting trade policies could continue impacting margins and investor sentiment.

Intense Competition

The battery sector is crowded with large, well-capitalized competitors. Companies across China, South Korea, Japan, Europe, and the United States continue investing aggressively in battery manufacturing capacity and chemistry innovation.

Speculative Nature of the Stock

MVST remains a speculative small-cap growth company. Stocks in this category often experience extreme volatility, dilution risk, and rapid shifts in investor sentiment. The company’s share price history reflects that reality.

Investment Outlook

Microvast represents a classic high-risk, high-reward investment profile. Bulls see an undervalued battery technology company positioned for long-term electrification trends. Bears see a financially unstable company operating in a fiercely competitive industry with geopolitical baggage and inconsistent execution.

For investors considering MVST, the key questions may revolve around whether management can stabilize revenue growth, maintain margin improvements, and achieve sustainable profitability before capital markets become less accommodating for speculative growth companies.

Disclosure

The author owns a position in MVST. This article reflects personal opinions and is intended for informational and educational purposes only. It should not be considered financial advice or a recommendation to buy or sell securities. Investors should conduct their own due diligence and consider their risk tolerance before investing.

References

Microvast Holdings, Inc. (2026, March 16). Microvast reports 2025 financial results. Microvast Investor Relations. https://ir.microvast.com/news-releases/news-release-details/microvast-reports-2025-financial-results

Microvast Holdings, Inc. (2026, May 11). Microvast reports first quarter 2026 financial results. Microvast Investor Relations. https://ir.microvast.com/news-releases/news-release-details/microvast-reports-first-quarter-2026-financial-results

Yahoo Finance. (2026). Microvast Holdings, Inc. (MVST) stock price, news, quote & history. https://finance.yahoo.com/quote/MVST/

Wikipedia contributors. (2026). Microvast. Wikipedia. https://en.wikipedia.org/wiki/Microvast

Investing.com. (2026, March 16). Microvast FY2025 slides show margin strength as US revenue surges. https://www.investing.com/news/company-news/microvast-fy2025-slides-show-margin-strength-as-us-revenue-surges-173-93CH-4564169

MarketBeat. (2026, May 11). Microvast Q1 earnings call highlights. https://www.marketbeat.com/instant-alerts/microvast-q1-earnings-call-highlights-2026-05-11/

Ondas Holdings ($ONDS): A High-Risk, High-Reward Play on Autonomous Defense and AI Infrastructure

Ondas Holdings has rapidly emerged as one of the more closely watched small-cap companies in the autonomous systems and defense technology sector. The company operates through its Ondas Autonomous Systems division, focusing on AI-powered drone platforms, counter-drone defense technologies, and private wireless infrastructure designed for critical industries and government agencies.

Drone flying over a border fence scanning the area with sensors at sunset
A drone scans a border fence at sunset using advanced sensors.

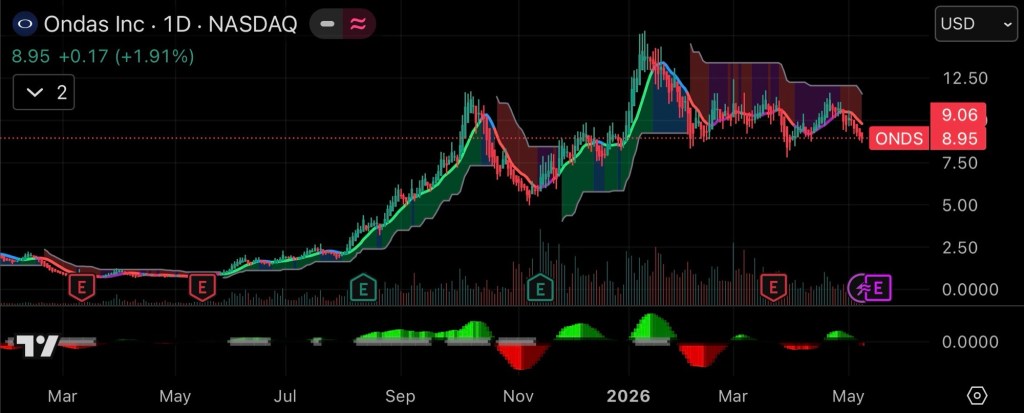
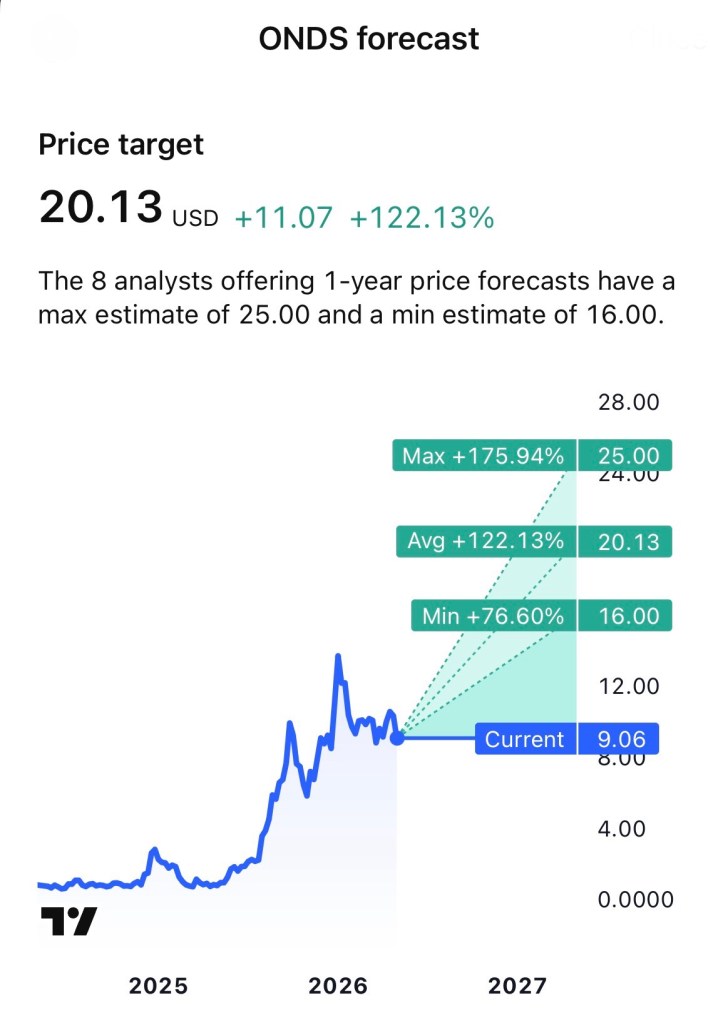
Over the past year, investor interest in ONDS has accelerated as geopolitical tensions, rising defense spending, and demand for autonomous security systems have expanded globally. The company’s partnerships, acquisitions, and expanding backlog have positioned it as a speculative growth stock with significant upside potential but also elevated volatility and execution risk.

According to recent company updates, Ondas reported preliminary 2025 revenue between $49.7 million and $50.7 million, substantially ahead of prior guidance. Management also increased its 2026 revenue outlook to as much as $375 million, supported by growing defense contracts and autonomous drone deployments.

The Core Investment Thesis

Ondas is attempting to build an integrated autonomous intelligence ecosystem combining:

  • Autonomous drones
  • Counter-UAS defense systems
  • AI-driven operational software
  • Remote wireless communications infrastructure
  • Border and critical infrastructure monitoring systems

Its flagship technologies include:

  • Optimus drone systems
  • Iron Drone Raider counter-UAS platforms
  • Scout autonomous systems
  • AI-enabled command-and-control architecture

The company has increasingly focused on military, homeland security, and infrastructure applications where demand has accelerated globally.

One of the most notable developments for investors was Ondas’ partnership with Palantir Technologies to integrate Palantir’s AI and data fusion capabilities into Ondas autonomous systems. Analysts believe this partnership could improve scalability and strengthen Ondas’ positioning in next-generation defense operations.

Short-Term Growth Outlook

In the short term, ONDS remains heavily momentum-driven. Several catalysts could impact the stock over the next 6–12 months:

1. Expanding Defense Contracts

Ondas recently announced:

  • Multi-million-dollar European airport security contracts
  • New Middle East counter-drone orders
  • A $20 million autonomous border security program

These announcements suggest accelerating commercial adoption of autonomous security systems.

2. Revenue Acceleration

Management forecasts dramatic year-over-year growth in 2026 revenue, supported by an expanding backlog and defense demand. Revenue growth has become one of the primary bullish arguments for the stock.

3. Retail and Institutional Interest

ONDS has gained traction among retail traders and defense-focused growth investors. Increased trading volume and short interest could continue to create sharp price swings.

4. Upcoming Earnings

Investors are closely watching the company’s next earnings release scheduled for May 14, 2026, which may provide additional guidance and contract updates.

Long-Term Opportunities

The longer-term opportunity for Ondas centers on becoming a major provider of autonomous infrastructure systems.

Potential long-term drivers include:

  • Global expansion of autonomous defense systems
  • AI-enabled battlefield coordination
  • Smart city and critical infrastructure monitoring
  • Border protection technologies
  • Autonomous aviation and robotics
  • NATO and allied defense modernization

The company also benefits from broader trends in:

  • Defense digitization
  • Drone warfare evolution
  • AI-enhanced surveillance
  • Critical infrastructure protection

If management successfully scales operations and improves profitability, Ondas could evolve from a speculative small-cap into a more established defense technology company over the next 3–5 years.

However, risks remain substantial.

Key Risks Investors Should Monitor

Despite its growth story, ONDS carries elevated risk factors:

  • Continued net losses
  • Potential shareholder dilution
  • Dependence on government contracts
  • Execution risk on scaling production
  • Competitive pressure from larger defense firms
  • High stock volatility
  • Heavy reliance on future growth projections

The company is still in an aggressive expansion phase and has not yet established consistent profitability.

Competitive Landscape

CompanyPrimary FocusMarket PositionRelative Financial Strength
Ondas HoldingsAutonomous drones, counter-UAS, AI systemsEmerging small-cap disruptorSpeculative / growth-stage
AeroVironmentMilitary drones and loitering munitionsEstablished defense contractorStrong
Palantir TechnologiesAI defense software and analyticsAI infrastructure leaderVery strong
Kratos Defense & Security SolutionsAutonomous defense systemsMid-cap defense innovatorModerate to strong
DroneShieldCounter-drone defense technologySpecialized counter-UAS playerModerate

ONDS Stock Performance Snapshot

MetricData
Current Share PriceApproximately $9
52-Week PerformanceSignificant volatility with major upside swings
Market CapApproximately $2.35 billion
SectorAerospace & Defense Technology
ProfitabilityCurrently unprofitable
Revenue TrendRapid growth trajectory
Analyst SentimentBullish but speculative

Market data current as of May 2026.

Financial Strength Overview

CategoryAssessment
Revenue GrowthStrong
Cash PositionImproving
Debt ManagementModerate risk
ProfitabilityWeak currently
Backlog GrowthStrong
Institutional InterestIncreasing
Share Dilution RiskElevated

Final Analysis

Ondas Holdings represents one of the more aggressive speculative opportunities in the autonomous defense and AI-enabled drone market. The company is benefiting from powerful macro trends including rising defense budgets, geopolitical instability, and increased demand for autonomous systems.

For aggressive growth investors, ONDS may offer substantial upside if management successfully executes on revenue expansion and large-scale deployment opportunities. However, the stock remains highly volatile and should likely be viewed as a speculative position within a diversified portfolio rather than a conservative core holding.

Investors considering ONDS should closely monitor:

  • Earnings growth
  • Contract execution
  • Cash burn
  • Share dilution
  • Defense spending trends
  • AI partnership developments

Disclosure

The author currently owns a position in Ondas Holdings $ONDS. This article reflects personal opinions and is intended for informational purposes only. It should not be considered financial advice or a recommendation to buy or sell securities. Investors should conduct their own due diligence and consult a licensed financial advisor before making investment decisions.

References

ServiceNow Navigates Market Volatility With Strong Fundamentals and AI Momentum

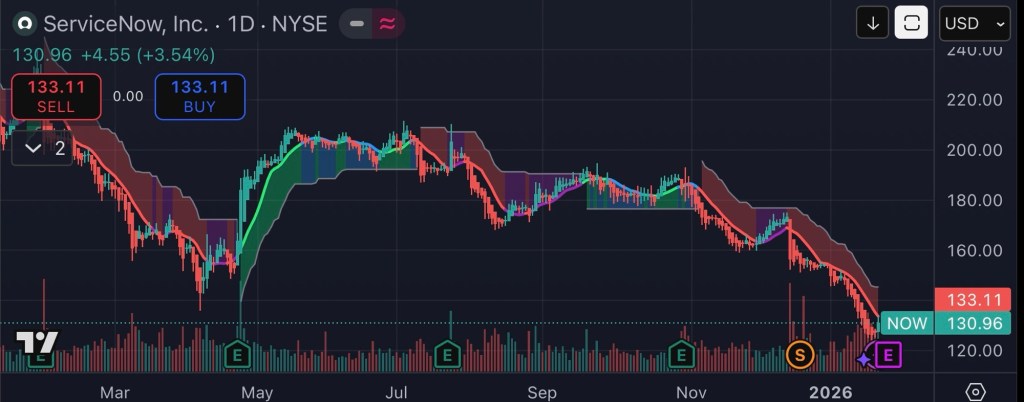
ServiceNow, Inc. (NYSE: NOW), the enterprise workflow automation and AI-driven software company, is attracting renewed investor attention as it enters its next earnings period with mixed signals from the market. After a prolonged sell-off in 2025 and early 2026, shares have shown signs of stabilization ahead of quarterly results due this week, while analysts revise forecasts on both the upside and downside.

Market Context:
As of the most recent close, ServiceNow’s stock price finished at $133.11, up 3.5% on positive sentiment ahead of earnings week. (TechStock²) The company’s shares have experienced significant pressure over the past year, falling roughly 30–50 percent from prior highs, signaling broader investor caution within the enterprise software sector. (TradingView+1)


Recent Financial Performance

ServiceNow’s underlying financial performance remains robust despite stock price challenges:

MetricMost Recent Reported
Q3 2025 Revenue$3.407 billion (+22% YoY) (GuruFocus)
Subscription Revenue$3.299 billion (+21.5% YoY) (GuruFocus)
Q3 2025 EPS$2.40 (beats expectations) (GuruFocus)
Q2 2025 Subscription Revenue$3.113 billion (+22.5% YoY) (ServiceNow Investor Relations)
Performance Obligations (RPO)$23.9 billion (+29% YoY) (ServiceNow Investor Relations)

ServiceNow also continues to expand its customer base, with strong demand in large enterprises and sustained growth in contract value obligations. (ServiceNow Investor Relations)

Financial Chart (Selected Historical & Forecast Data):

Metric / Timeframe2024 Actual2025 ActualAnalyst 2026 Avg Target
Revenue Growth~21% YoY~22% YoY— (Estimated Stable Growth)
Stock Price (Year-End)~$239.62 (52-wk high) (MarketWatch)~$128–134 range (MarketWatch)Consensus ~ $209.07 Avg (MarketBeat)
Analyst Price Target Range$170–$263 (TipRanks)Consensus Moderate Buy$209.07 Average 12-mo (MarketBeat)

Catalysts and Risks

Positive Drivers:

  • AI Integration and Partnerships: The company’s strategic deployment of AI capabilities particularly through deepening enterprise AI products and partnerships positions it within one of the fastest-growing segments of enterprise software. (The Wall Street Journal)
  • Earnings Beats: Recent quarters have seen revenue and EPS exceed consensus estimates, reinforcing the company’s pricing power and durability even in more cautious macro environments. (Nasdaq)
  • Stock Split Authorization: A board-approved 5-for-1 stock split aims to improve liquidity and broaden retail investor ownership. (Yahoo Finance)

Challenges:

  • Valuation Compression: Analysts have trimmed price targets in light of broader software sector rotation, leading to downward revisions that reflect caution ahead of earnings and uncertain macro conditions. (Ad Hoc News)
  • Market Sentiment: Software stocks broadly have underperformed amid shifting investor preferences toward semiconductors and AI infrastructure names, contributing to valuation pressure for ServiceNow. (Investopedia)

Analyst Forward Outlook & Stock Price Forecast (Next 12 Months)

Market forecasts reflect a moderate buy consensus for NOW with meaningful upside potential despite short-term volatility:

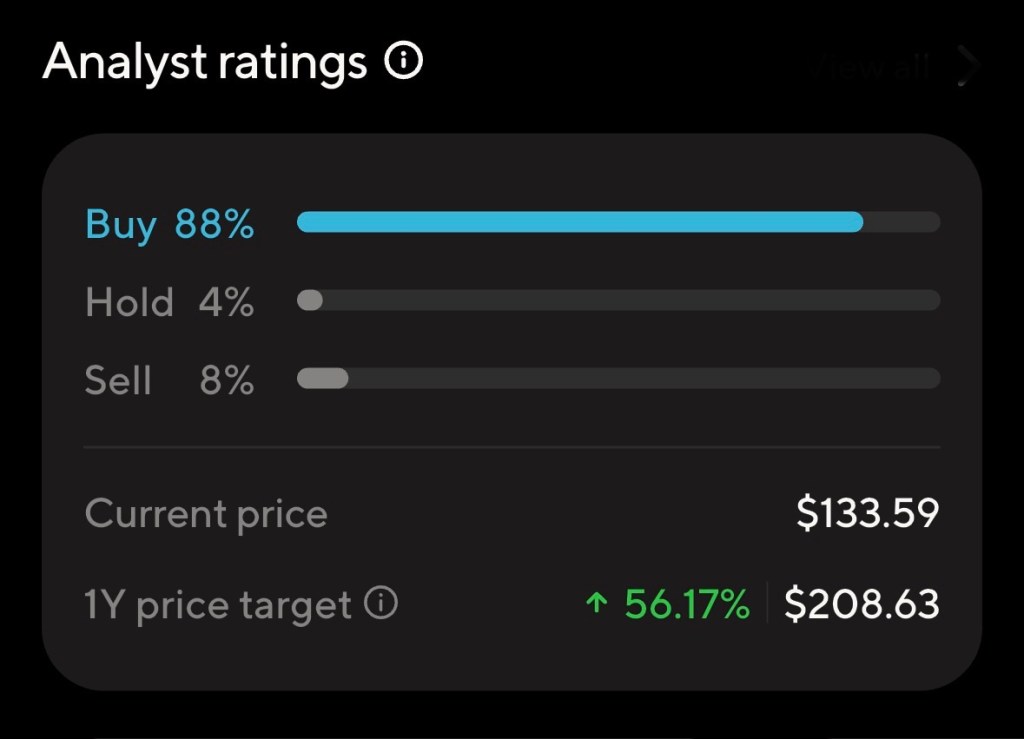
  • MarketBeat Consensus: Average 12-month price target of $209.07 — implying approximately 57% potential upside from current levels. (MarketBeat)
  • TipRanks Data: Average analyst target range of $170 to $263, with a “Strong Buy” consensus overall. (TipRanks)
  • Bullish Scenarios: Some analysts project further expansion toward historical peer valuations if growth and AI monetization accelerate. (TIKR.com)

Projected Price Range in One Year: $180–$250, contingent upon execution of AI initiatives, macro stability, and continued enterprise software demand.


Disclosure

I currently hold a position in ServiceNow (NYSE: NOW). This article is for informational purposes only and does not constitute financial advice. Investors should conduct independent research before making investment decisions.


References

Investing.com. (2025, October 30). Wells Fargo raises ServiceNow stock price target to $1,275 on higher estimates. Retrieved from Investing.com. Investing.com
MarketBeat. (2026). ServiceNow (NOW) Stock Forecast & Price Target. Retrieved from MarketBeat. MarketBeat
MarketWatch. (2026, January). ServiceNow Inc. stock data. Retrieved from MarketWatch. MarketWatch
TradingView/ Invezz. (2026). Here’s why the ServiceNow stock price is tanking. Retrieved from TradingView. TradingView
TechSite (TS2.Tech). (2026, January 24). ServiceNow stock price jumps 3.5% into earnings week. Retrieved from TS2.Tech. TechStock²
Tikr (2026). After a 31% fall in the last 12 months, can ServiceNow recover in 2026? Retrieved from Tikr. TIKR.com
WSJ. (2026). OpenAI and ServiceNow Strike Deal to Put AI Agents in Business Software. Retrieved from The Wall Street Journal. The Wall Street Journal
ServiceNow Investor Relations. (2025). ServiceNow Reports Second Quarter 2025 Financial Results. Retrieved from ServiceNow IR. ServiceNow Investor Relations
GuruFocus News. (2025, October 30). ServiceNow Inc (NOW) Q3 2025 Earnings: EPS of $2.40 Beats Estimates. Retrieved from GuruFocus. GuruFocus

Talos Energy (NYSE: TALO): A Strategic Energy Investment Entering 2026

Talos Energy Inc. (NYSE: TALO), an independent offshore oil and gas exploration and production company focused primarily on the U.S. Gulf of Mexico, is emerging as a notable energy equity entering 2026. With improving operational efficiency, disciplined capital allocation, and renewed analyst optimism, Talos presents a risk-adjusted opportunity for investors seeking exposure to offshore energy assets.

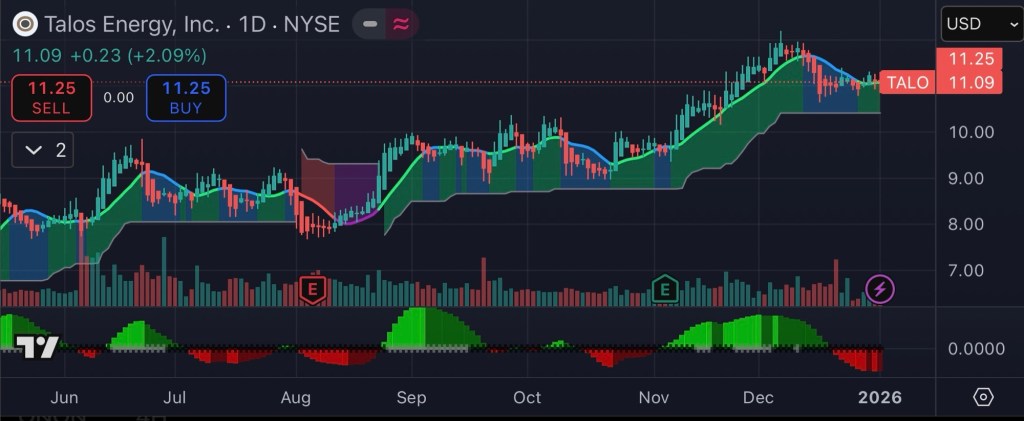
As of early January 2026, Talos Energy shares are trading near $11.25, recently touching a 52-week high of approximately $11.64, reflecting improving technical momentum and investor sentiment (Investing.com, 2025).

Operational Performance and Financial Progress

Talos Energy reported solid operational execution throughout 2025 despite a volatile commodity pricing environment. In its third quarter 2025 earnings report, the company disclosed average production of approximately 95.2 thousand barrels of oil equivalent per day (MBoe/d), supported by strong performance across its core offshore assets (Talos Energy Inc., 2025a).

Notably, Talos generated over $100 million in adjusted free cash flow during Q3 2025, enabling share repurchases and reinforcing management’s emphasis on shareholder returns and balance sheet strength (Talos Energy Inc., 2025a). While net income remained pressured by non-cash impairment charges, free cash flow generation has become a central pillar of the company’s investment thesis.

Strategic Initiatives and Growth Drivers

Talos has outlined an enhanced corporate strategy aimed at improving capital efficiency and long-term cash flow sustainability. Management has indicated a goal of achieving approximately $100 million in incremental annualized cash flow entering 2026, driven by operational efficiencies, optimized drilling programs, and cost discipline (Talos Energy Inc., 2025b).

Exploration remains another key catalyst. The company’s Daenerys discovery in the Gulf of Mexico has shown promising results, with appraisal drilling planned for 2026. Successful development could materially expand Talos’ reserve base and future production profile (Talos Energy Inc., 2025a).

In addition, broader offshore industry trends may serve as tailwinds. According to Reuters (2025), improved drilling economics and declining onshore productivity are refocusing attention on offshore Gulf of Mexico assets, potentially supporting higher long-term valuations for companies like Talos.

Market Sentiment and Analyst Outlook

From a technical perspective, Talos Energy has demonstrated improving relative strength. The stock earned a Relative Strength (RS) Rating above 80, signaling outperformance versus the broader market and attracting momentum-oriented investors (Investor’s Business Daily, 2025).

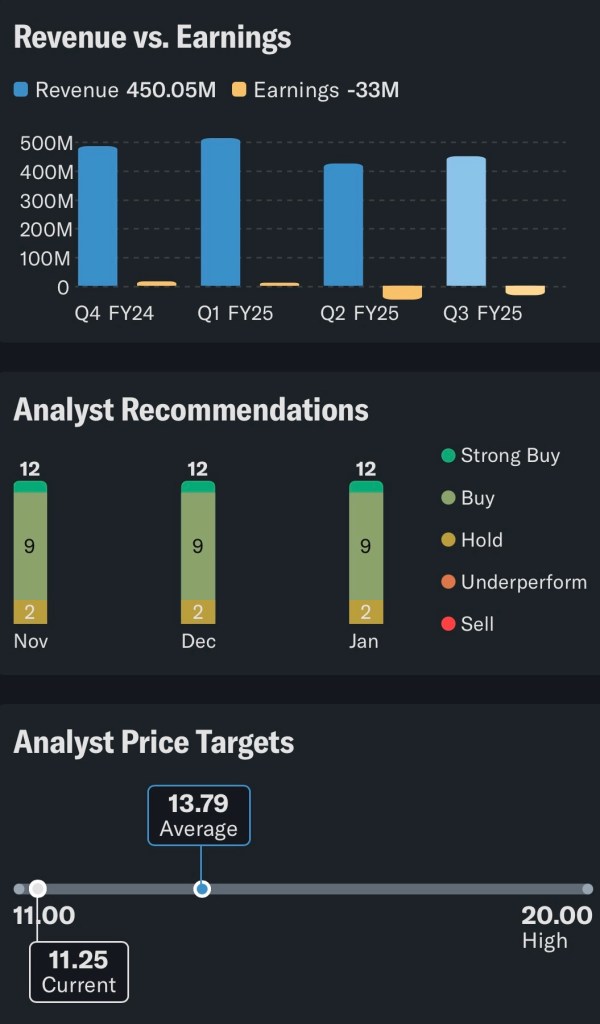
Analyst sentiment is moderately bullish. Consensus estimates reflect an average 12-month price target near $14–$15, with more optimistic forecasts reaching $20 per share, implying meaningful upside if execution and commodity pricing align favorably (StockAnalysis.com, 2025; Investing.com, 2025).

Risks to Consider

Despite improving fundamentals, Talos Energy is not without risk. The company remains sensitive to fluctuations in oil and natural gas prices, and earnings volatility persists due to capital-intensive offshore operations. Exploration results, regulatory considerations, and macroeconomic factors could all impact performance.

Investors should also note that sustained profitability has yet to be firmly established on an annual basis, making execution in 2026 a critical determinant of valuation expansion.

2026 Price Outlook

Based on current fundamentals, analyst projections, and sector trends, several scenarios appear plausible for Talos Energy by the end of 2026:

  • Base Case: Stable commodity prices and continued execution support a valuation in the $14–$16 range.
  • Bullish Case: Successful exploration, higher oil prices, and sustained free cash flow expansion could drive shares toward $18–$20+.
  • Bearish Case: Commodity weakness or operational setbacks may limit upside and keep shares range-bound near current levels.

Conclusion

Talos Energy enters 2026 positioned as a leveraged play on offshore energy resilience and operational discipline. While risks remain inherent, the company’s improving free cash flow profile, exploration upside, and favorable analyst sentiment suggest that TALO may offer attractive long-term potential for investors with a tolerance for volatility.


Disclosure

The author owns a position in Talos Energy (NYSE: TALO). This article is for informational purposes only and does not constitute financial or investment advice. Readers are strongly encouraged to conduct their own research and consult a qualified financial professional before making any investment decisions.


References

Investing.com. (2025, December 3). Talos Energy stock reaches 52-week high at 11.64 USD. Investing.com. https://www.investing.com/news/company-news/talos-energy-stock-reaches-52week-high-at-1164-usd-93CH-4388939

Investor’s Business Daily. (2025, December 30). Stocks showing improving market leadership: Talos Energy earns 81 RS rating. https://www.investors.com/ibd-data-stories/stocks-showing-improving-market-leadership-talos-energy-earns-81-rs-rating/

Reuters. (2025, October 15). Improved drilling to boost Gulf of Mexico offshore oil output as U.S. onshore growth slows. Reuters. https://www.reuters.com/business/energy/improved-drilling-boost-gulf-mexico-offshore-oil-output-us-onshore-growth-slows-2025-10-15/

StockAnalysis.com. (2025). Talos Energy (TALO) stock forecast and analyst price targets. https://stockanalysis.com/stocks/talo/forecast/

Talos Energy Inc. (2025a, November 5). Talos Energy announces third quarter 2025 operational and financial results. https://www.talosenergy.com/investor-relations/news/news-details/2025/Talos-Energy-Announces-Third-Quarter-2025-Operational-and-Financial-Results/

Talos Energy Inc. (2025b, June 17). Talos Energy announces enhanced corporate strategy. https://www.talosenergy.com/investor-relations/news/news-details/2025/Talos-Energy-Announces-Enhanced-Corporate-Strategy/

Understanding the Santa Claus Rally: A Swing Trader’s Guide

As the calendar closes out and holiday cheer replaces headline noise, U.S. stock markets often show a predictable burst of strength known as the Santa Claus Rally — a short, historically favorable window that many swing traders lean on for quick, low-risk setups. The rally is narrowly defined, reliably rewarded by the data, and backed by a handful of market mechanics (low volume, year-end flows, tax-related reversals) that can amplify short-term moves exactly the conditions swing traders seek. (Investopedia+1)

What is the Santa Claus Rally (timeframe)?

The conventional definition credited to Yale Hirsch and the Stock Trader’s Almanac is the last five trading days of December plus the first two trading days of January (a seven-trading-day window). That short span is when seasonal strength historically concentrates, rather than across the whole of December. (Stock Trader’s Almanac+1)

The numbers: how the S&P 500 and Dow have performed

  • S&P 500: Since roughly 1950, the S&P 500 has averaged about +1.3% over the seven trading days of the Santa Claus Rally, with positive returns roughly 78–79% of the time. That beats a typical seven-day period’s average return and win-rate. (Investopedia+1)
  • Dow Jones Industrial Average: Using the classic post-Christmas window, the Dow has historically been positive about 77% of the time, with average gains in the same ballpark as the S&P by some measures (studies often report roughly +1.4% in the period). (MarketWatch+1)
  • Relative context: Analysts note the Santa Claus window’s 1.3% average gain contrasts with a much smaller average seven-day return (around 0.3%), underscoring the period’s above-normal edge. (LPL)

(These figures come from long-range studies and market almanacs; different start dates or sample periods shift the precise numbers slightly but not the broad conclusion.) (Stock Trader’s Almanac+1)

Why this period favors swing trading

  1. Condensed upside in a known short window. Swing trading profits from predictable, short moves a seven-day, high-probability uptick is exactly that. Historical win-rates near the ~78% mark give a favorable edge if position sizing and risk controls are used. (Investopedia)
  2. Lower volatility and thinner volume. Holiday trading often sees lighter volume and fewer market-moving news items; prices can drift more cleanly in one direction, letting swing setups (breakouts, momentum continuations, mean-reversion bounces) play out with less intraday whipsaw. (Lower volume can magnify moves in the direction of flows.) (Corporate Finance Institute+1)
  3. End-of-year flows and positioning. Institutional flows (window dressing, year-end rebalancing, bonus/retirement contributions) and a reversal of tax-loss selling can create concentrated buying pressure around year-end and early January. Big inflows into equities have been cited as a driver in some recent Santa rallies. (MarketWatch+1)
  4. Correlation with January and the new year. Historically, a positive Santa Claus Rally has sometimes preceded stronger January returns and a more bullish full year a dynamic that can attract more buyers into the short window and amplify momentum. (This is a correlation, not a guarantee.) (LPL+1)

Practical swing-trader playbook (how to trade it)

  • Time the window. Look for entries during the last five trading days of December and use targets or exits by the first two trading days of January (or earlier if your plan dictates). The edge is short-lived don’t stretch holding periods beyond the seasonality. (Stock Trader’s Almanac)
  • Trade probability, not hope. Use setups with clear technical evidence (breakout on rising RSV/volume, pullback to moving average, bullish RSI divergence). Favor names with existing positive momentum.
  • Risk control is essential. Even periods with high historical win-rates can fail; use tight stops, sensible position sizing, and consider defined-risk instruments (protective puts or small options trades) if you want asymmetric payoff.
  • Use ETFs for broad exposure. If you want to play the seasonal tilt without single-stock risk, liquid ETFs (SPY, QQQ, DIA) can capture the move and provide easy entries/exits.
  • Watch volume & implied volatility. Low volume can help moves trend but can also create thin markets. Options traders should check implied volatility seasonality can compress IV, affecting premium strategies.
  • Consider small-cap/January effect overlap. If you’re a swing trader who also trades small caps, remember the broader January Effect can lift small-cap names in the early month, offering extra upside for appropriately sized trades. (Plus500)

Indicators and signals traders often monitor

  • Short interest and buybacks low supply + active buybacks can help push prices.
  • Seasonal inflows / fund flows (ETF inflows, mutual fund windows) high year-end inflows can sustain rallies. (MarketWatch)
  • Volatility (VIX) trend falling VIX into year-end often accompanies risk-on moves; a sudden spike can kill momentum.
  • Breadth measures (advance/decline lines, number of stocks above 50-day MA) confirm whether the rally is broad-based or just a narrow megacap lift. (Broad rallies are more robust for swing trades across sectors.)

A quick caution

Seasonal patterns are statistical tendencies, not certainties. Past performance is not a guarantee of future results. There have been years without a Santa Claus Rally (and even reverse episodes), and macro surprises — policy shocks, geopolitical events, or sudden earnings shocks can reverse the move. Traders should use the seasonal edge as one input among many, not a sole decision rule. (Morningstar+1)

What this means for investors is simple:

The Santa Claus Rally is a short, well-defined window (last five trading days of December + first two trading days of January) that historically offers above-average returns and a high probability of positive performance for major indices like the S&P 500 and the Dow. Those characteristics concentrated upside, lower intraday noise, and supportive year-end flows make it an attractive environment for disciplined swing traders who pair tight risk controls with high-probability setups. Just remember: seasonality improves the odds, it doesn’t eliminate risk. (Investopedia+2MarketWatch+2)

References

Canopy Wealth. (2024, December 19). What is the Santa Claus Rally? https://www.canopy-wealth.com/blog/what-is-the-santa-claus-rally Canopy Wealth Management
Corporate Finance Institute. (n.d.). Santa Claus Rally – Overview, Causes, Retrospective. https://corporatefinanceinstitute.com/resources/career-map/sell-side/capital-markets/santa-claus-rally/ Corporate Finance Institute
Interactive Brokers. (2024, December 13). Chart Advisor: Get Ready for the Real Santa Claus Rally. https://www.interactivebrokers.com/campus/traders-insight/chart-advisor-get-ready-for-the-real-santa-claus-rally/ Interactive Brokers
InvestingNews. (2024, December 24). What Is the Santa Claus Rally and Has it Arrived? https://investingnews.com/santa-claus-rally/ Investing News Network (INN)
Investopedia. (2024, December 20). Santa Claus Rally: What It Is and Means for Investors. https://www.investopedia.com/terms/s/santaclauseffect.asp Investopedia
Investopedia. (n.d.). The Santa Claus Rally. https://www.investopedia.com/the-santa-claus-rally-4779941 Investopedia
LPL Research. (2025, January 2). Santa Claus Rally in Jeopardy. https://www.lpl.com/research/blog/santa-claus-rally-in-jeopardy.html LPL
SmartAsset. (2025, August 14). Is the Santa Claus Rally Real? – 2020 Study. https://smartasset.com/financial-advisor/santa-claus-rally-2020 SmartAsset
TSPSmart. (n.d.). Santa Claus Rally. https://tspsmart.com/Santa-Claus-Rally TSP Smart

Understanding MINA: Risks and Rewards in the Crypto Market

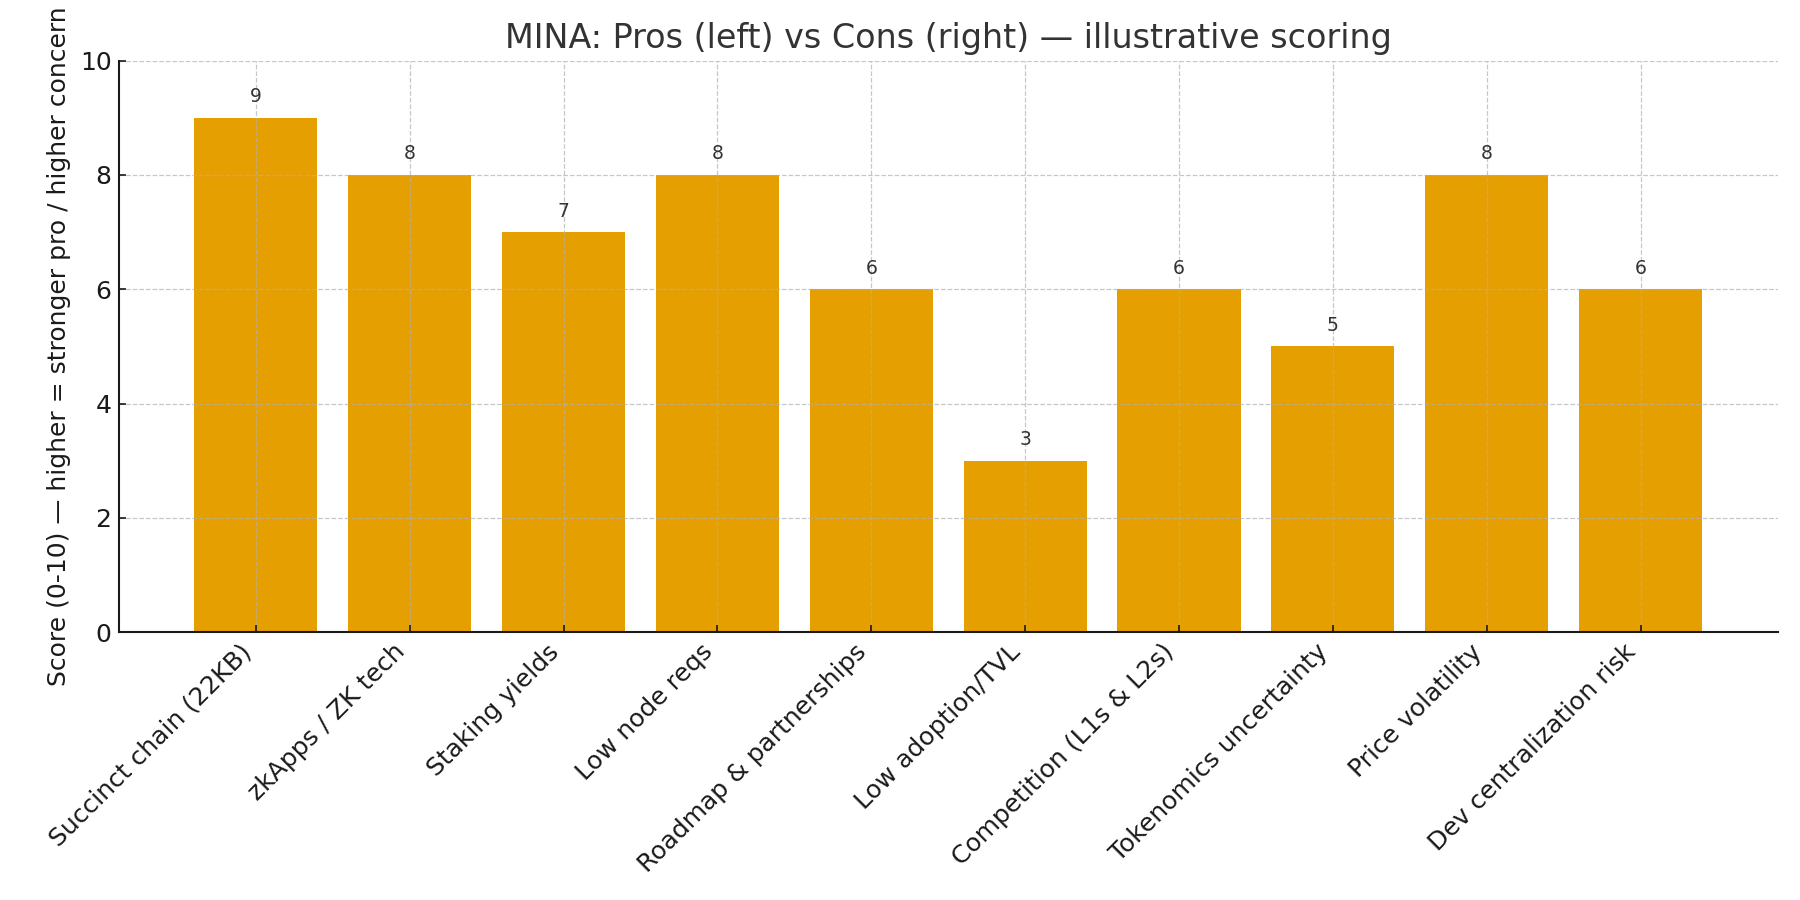
Mina Protocol markets itself as the “lightest blockchain” — a layer-1 that stays tiny by using recursive zero-knowledge proofs (zk-SNARKs) so the entire chain remains a succinct ~22KB snapshot instead of a growing ledger. That design promises a blockchain any device can verify, lowering node requirements and enabling on-device privacy-aware dApps (zkApps). Those technical foundations are Mina’s headline differentiator and the core reason some investors treat MINA as a long-term hold. (Mina Protocol+1)

Where MINA stands right now

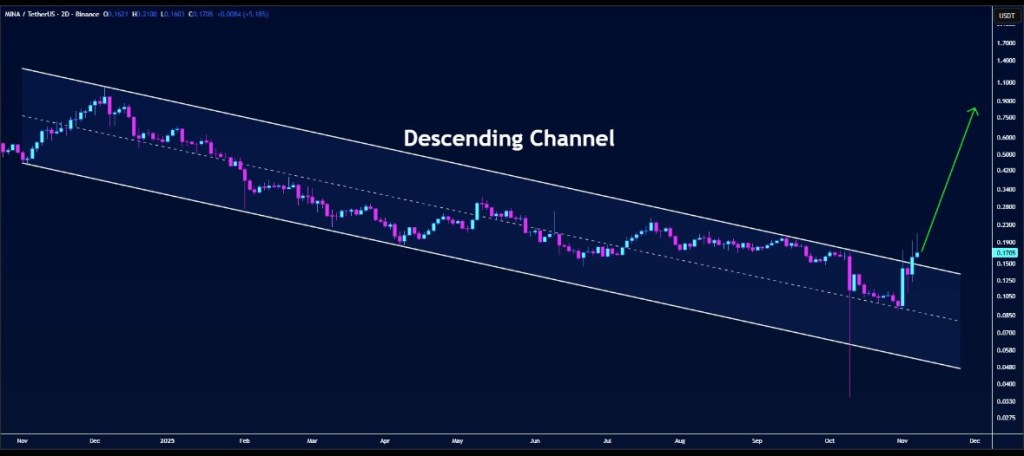
As of early November 2025, MINA trades in the low-to-mid $0.17–$0.19 range with a market cap in the low hundreds of millions of dollars and roughly 1.26 billion MINA circulating. Price and ranking vary by source and exchange, but major market trackers show MINA as a mid-to-low market-cap altcoin. (CoinMarketCap+1)

Why investors like MINA — the bullish case

  1. Truly lightweight chain: Mina’s constant-sized blockchain (~22KB) lowers the hardware and bandwidth needed to run a full node, which could help decentralize participation and boost mobile/edge use cases. This is fundamental to Mina’s pitch as a “blockchain for everyone.” (Nansen Research+1)
  2. Zero-knowledge programmability (zkApps): Mina’s zkApp framework enables privacy-preserving smart contracts and verifiable off-chain computation. If ZK tech becomes central to mainstream Web3 privacy and scaling, Mina could capture unique developer interest. (Mina Protocol)
  3. Staking yields / network rewards: MINA supports staking and many exchanges and platforms offer competitive staking APRs (examples reporting 6–12% or higher on various platforms), which attracts yield-seeking holders who prefer passive income while they wait for price appreciation. (Kraken+1)
  4. Active roadmap and ecosystem work: Core development groups and community initiatives continue evolving Mina (roadmaps and upgrades in 2024–25 aim at tooling, zk developer onboarding, and greater interoperability). Continued protocol development can improve utility and adoption. (Mina Protocol+1)
  5. Relatively small market cap = upside if narrative wins: Compared with top L1s, Mina’s market cap is modest, so positive adoption or a crypto risk-on rotation could produce outsized percentage gains (classic “small-cap upside” dynamic).

Risks and why caution is warranted

  1. Adoption & TVL remain low vs major L1s: For MINA to move materially higher, it needs more apps, users, and locked value. Today it’s still a niche stack versus giants like Ethereum, Solana, or new ZK-focused rivals. Low TVL limits organic utility demand for the token. (CoinGecko+1)
  2. Strong competition: Other projects are pursuing ZK tech, rollups, and lightweight verification. If larger ecosystems integrate similar ZK capabilities (or if Ethereum rollups dominate the ZK narrative), Mina’s unique edge could shrink. (o1Labs)
  3. Tokenomics & supply dynamics: A large circulating supply (~1.26B MINA) and ongoing issuance/staking rewards can dilute price upside unless demand grows to absorb supply. Coin trackers list circulating supply but no fixed “max” supply, so inflation mechanics matter to holders. (CoinMarketCap)
  4. Price volatility & market risk: As a mid/low-cap crypto, MINA is susceptible to broad market moves, liquidity shocks, and volatility — factors that can erase gains quickly. Historical price charts show sharp swings that should caution risk-sensitive investors. (Yahoo Finance)
  5. Technology / centralization risk: While Mina’s research teams (o1 Labs, Mina Foundation, community contributors) are active, concentrated development or coordination risks exist — and any delays or setbacks to roadmap items could temper market enthusiasm. (o1Labs)

Potential upside in an “altcoin season”

Altcoin seasons reward narratives — smaller caps with clear, differentiated value propositions often run hardest. Mina’s narrative (real ZK programmability + tiny chain size) fits a neat theme: privacy, edge verification, and on-device dApps. If the ZK narrative accelerates — through developer tool improvements, interoperability wins (projects like Aligned working on ZK verification integrations), or a wave of zkApps adoption — MINA could outpace larger, less nimble chains. Several mid-2024–25 developments and roadmap items indicate the team remains focused on ZK tooling and ecosystem funding, which would be the necessary fuel for such a move. (o1Labs+1)

How an investor might position (not financial advice)

  • Long-term speculative hold: If you believe ZK tech and ultra-light clients matter, a small allocation to MINA (size depending on risk tolerance) could be reasonable — especially if you stake to capture yield while waiting for adoption. (Kraken)
  • Event-driven trade: Watch roadmap milestones, zkApp launches, partnerships (e.g., Aligned/Ecosystem announcements), and listings/staking product rollouts. Positive, repeated dev activity and growing on-chain usage are bullish triggers. (Mina Protocol+1)
  • Risk management: Given volatility and competition, position sizing, stop levels, and a clear thesis (what adoption metric would make you add more vs cut losses) are essential.

End Result

Mina’s technology is interesting and differentiated: a truly succinct chain with ZK programmability that theoretically lowers barriers to running full nodes and enables privacy-preserving dApps. That technical moat gives MINA a plausible role in a future Web3 where ZK proofs are central. However, adoption, TVL, competition, tokenomics, and market volatility remain the main hurdles. For investors, MINA looks like a classic higher-risk, higher-optional-upside altcoin: attractive to those who believe in ZK-native dApps and willing to stomach swings; less attractive to conservative crypto investors who prefer larger, more established L1 ecosystems. (Mina Protocol+2CoinMarketCap+2)

Disclaimer

I currently hold a position in MINA. The views and opinions expressed in this article are my own and are provided for informational purposes only. This content should not be construed as financial, investment, or trading advice. Always conduct your own research or consult with a licensed financial advisor before making investment decisions.

References

CoinMarketCap. (2025, November 8). Mina (MINA) price, charts, and market cap. Retrieved from https://coinmarketcap.com/currencies/mina-protocol/

Mina Foundation. (2025). Mina Protocol documentation and roadmap. Retrieved from https://docs.minaprotocol.com/

o(1) Labs. (2024). Mina Protocol: The world’s lightest blockchain powered by zero knowledge. Retrieved from https://o1labs.org/

Messari. (2024, December). Mina Protocol research profile. Retrieved from https://messari.io/asset/mina

CoinGecko. (2025, November 8). Mina (MINA) price and market data. Retrieved from https://www.coingecko.com/en/coins/mina-protocol

Binance Research. (2024). Understanding Mina Protocol: Lightweight blockchain and zkApps. Retrieved from https://research.binance.com/en/projects/mina

Aligned Layer. (2025). Mina zkApp integrations and ecosystem collaborations. Retrieved from https://www.alignedlayer.com/blog/mina-zkapps-integration

Decrypt. (2024, July 14). What is Mina Protocol and how does it use zero-knowledge proofs? Retrieved from https://decrypt.co/resources/what-is-mina-protocol

Staking Rewards. (2025). Mina staking overview and yields. Retrieved from https://stakingrewards.com/crypto-assets/mina/

“At the Trough” Why Webull Corporation (NASDAQ: BULL) Might Be Worth a Fresh Look

TAMPA – October 21, 2025 — The brokerage and trading-platform firm Webull Corporation (ticker BULL) finds itself trading near multi-year lows. For value-oriented investors, that raises a classic question: Is this a moment of opportunity, or a warning that things are worse than they appear?

Here’s what investors need to know:


1. The Case For: Potential Upside From a Low Base

  • Webull reported strong top-line growth in recent quarters. In Q1 2025, revenues rose by 32 % year-over-year to about US$117 million, and the company swung from a loss to a net income of around US$12.9 million. (PR Newswire+2StockAnalysis+2)
  • In Q2 2025, revenue came in at roughly US$131.5 million, up ~46 % vs Q2 2024 (~US$90.1 million) — showing accelerating growth in that period. (Investing.com+2WallStreetZen+2)
  • The stock has already fallen steeply from its earlier highs. Some market commentary suggests that when a stock has dropped hard, it might set up for a rebound if fundamentals improve. (Value The Markets+1)
  • Webull’s business model zero-commission trading, fractional shares, global expansion remains relevant in the growing world of retail finance and digital investing. Supportive structural tailwinds could help long-term. For example, the company claims global reach and a broad user base. (AInvest+1)

2. The Case Against: Key Risks That Still Loom

  • While revenue is growing, the annual full-year revenue for 2024 was essentially flat compared to 2023 (~US$390.2 million in both years) indicating growth isn’t guaranteed or smooth. (WallStreetZen+1)
  • Profitability remains a concern: Return on equity and profit margins are weak or negative in many recent periods. (Simply Wall St+1)
  • The company competes in a crowded sector (digital brokerages, fintech platforms) with strong incumbents like Robinhood Markets. Analysts have flagged slower growth vs bigger rivals. (Webull+1)
  • There are corporate-structure complexities and lock-up/share dilution risks. A financial-news piece noted that if the stock trades above US$12 for 20 days, up to 25 % of locked shares might be released, potentially expanding supply. (Money Morning)

3. Why “At All-Time Lows” Could Be a Turning Point

Many stocks trade at depressed levels because the market has lost confidence. That creates a scenario where:

  • The “bad news” may be largely baked into the price, so incremental positive surprises can have outsized impact.
  • A low base offers more upside potential if things go well (i.e., less downside cushion).
    For Webull, if growth continues and profitability improves, the market could reward the turnaround possibility. On the flip side, if risks intensify, the low price could still go lower.

4. What to Monitor Going Forward

Investors considering Webull should keep a close eye on:

  • Upcoming quarterly results: Are revenues continuing to grow at high rates? Are expenses under control?
  • Account growth and trading volume: How many active/funded accounts? What is customer asset growth?
  • Profit margins and net income: Are they trending toward consistent profitability?
  • Share-count / dilution risk: Are there significant new shares coming? Are previously locked shares being released?
  • Competitive dynamics and regulatory risks: Any new regulatory headwinds? How is Webull distinguishing itself vs other brokers?

5. Summary: A High-Risk, High-Potential Setup

In short: Webull is not a safe, boring investment. It carries meaningful operational and structural risk. But the combination of decent recent growth, a depressed share price, and a business model aligned with retail investing trends makes it plausible that at these levels, the upside could be interesting if things go right.

For investors comfortable with risk and looking for speculative exposure in the fintech/brokerage space, BULL might offer a worthwhile “bet.” For more conservative investors, the uncertainty may be too large.

Before investing, one should do their own due diligence, weigh risk vs reward carefully, and consider how this fits into an overall portfolio.


https://content.stockstotrade.com/wp-content/uploads/2025/10/watermarked_BULL_2025-10-10T14-05-scaled.png
https://csv-storage.forexpros.com/slides/ddc6db61fc7fc26d73488dab0804c906c7608c6f44146b9c7b259e50f98c47a1.png
https://csv-storage.forexpros.com/slides/dd5e6af6d041cd8914e7ac5f888864b9d9ff042c7f3bad9d0e458507b3c5eab2.png

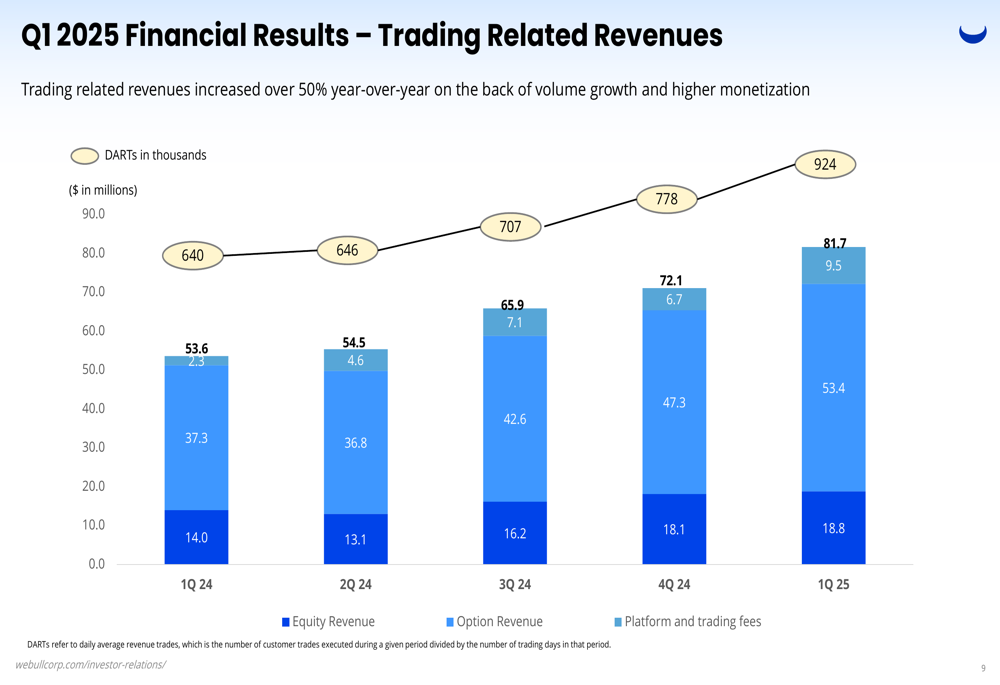
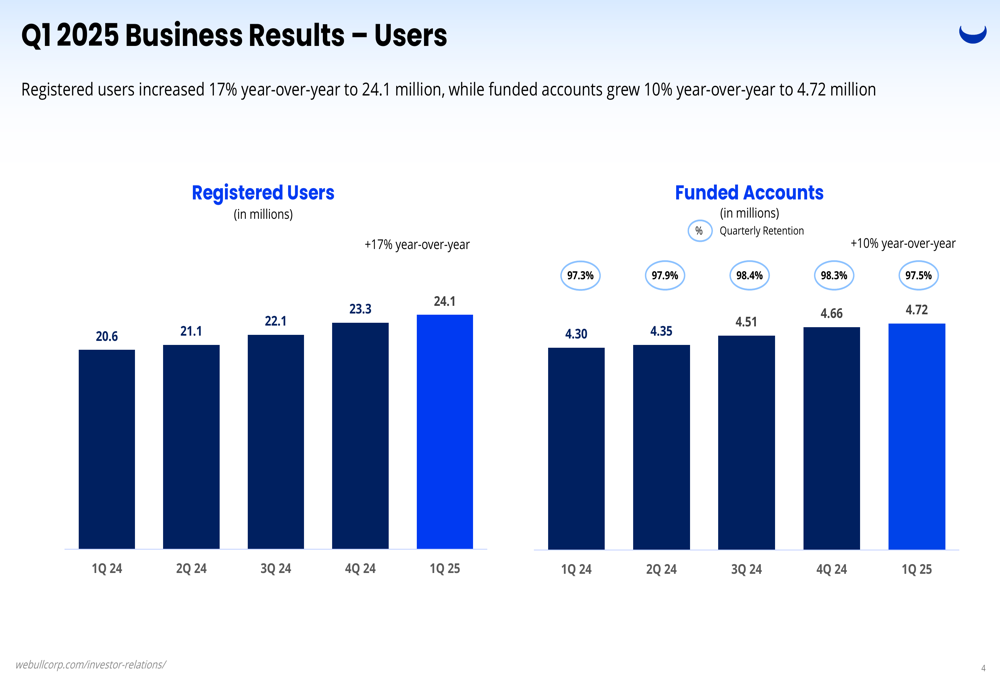
Above: Representative charts showing (1) share-price path of Webull (BULL), (2) recent revenue growth, (3) user growth/expansion metrics.


Disclaimer

This is not financial advice. The information above is for educational and informational purposes only. Investing involves risks, including loss of principal. Always consult a qualified financial advisor regarding your specific situation.

References

AINVEST. (2025, April 20). Webull stock: 2 reasons to buy, 4 reasons to sell. AINVEST.com. https://www.ainvest.com/news/webull-stock-2-reasons-buy-4-reasons-sell-2504-63/

Investing.com. (2025, August 8). Webull Q2 2025 slides: Revenue jumps 46%, achieves third profitable quarter. Investing.com. https://www.investing.com/news/company-news/webull-q2-2025-slides-revenue-jumps-46-achieves-third-profitable-quarter-93CH-4215463

Money Morning. (2025, April 14). Warning: Read this before you buy Webull (BULL) stock. MoneyMorning.com. https://moneymorning.com/2025/04/14/warning-read-this-before-you-buy-webull-bull-stock/

PR Newswire. (2025, May 13). Webull reports first quarter 2025 financial results. PR Newswire. https://www.prnewswire.com/news-releases/webull-reports-first-quarter-2025-financial-results-302463555.html

Simply Wall St. (2025). Webull Corporation (NASDAQ: BULL) past performance and analysis. SimplyWall.st. https://simplywall.st/stocks/us/diversified-financials/nasdaq-bull/webull/past

Value The Markets. (2025, June 30). Webull Corporation stock (BULL): Is it a buy at these levels? ValueTheMarkets.com. https://www.valuethemarkets.com/analysis/webull-corporation-stock-bull

WallStreetZen. (2025). Webull (BULL) revenue 2023–2025. WallStreetZen.com. https://www.wallstreetzen.com/stocks/us/nasdaq/bull/revenue

Webull. (2025, July 22). Webull news update: Market and company overview. Webull.com. https://www.webull.com/news/12711197501137920

Conduent Incorporated ($CNDT): Q2 2025 Snapshot, Balance-Sheet Health, and Where the Stock Stands for Gains

Conduent Incorporated, the business-process-services company spun out from Xerox, reported mixed results through early 2025 as it works to convert cost cuts and restructuring into sustainable profit. The shares trade at a low single-digit price level, making the company a high-beta, speculative play for investors who believe management can consistently deliver margin improvement and free cash flow growth. (Conduent Investor)

Key headlines (what just happened)

  • Conduent reported second-quarter 2025 results in early August with revenue of roughly $754 million and GAAP net loss on a standalone basis (but continued improvements in adjusted metrics were highlighted by management). (Conduent Investor)
  • The company’s market capitalization sits in the hundreds of millions (Yahoo Finance shows market cap in the ~$440–460M range around current quotes), while enterprise value is notably higher because of net debt on the balance sheet. The stock price is trading near $2.80–$3.00 per share as of this writing. (Yahoo Finance)

Balance-sheet and financial-position analysis

Using the company filings and aggregated financial data, the balance-sheet picture for Conduent in the most recent filings shows several important characteristics:

  • Total assets / liabilities: Conduent’s total assets in recent annual/quarterly filings have been in the low-to-mid billions (annual totals around $2.6B–$3.2B), with total liabilities making up a substantial portion of that base. That translates to relatively thin shareholder equity compared with larger peers. (Yahoo Finance+1)
  • Leverage / net debt: Total long-term debt has historically been material — recent snapshots put total debt roughly in the high hundreds of millions to over $1B (enterprise value and total debt differ by source and date) — and net cash/(debt) has been negative (i.e., net debt). StockAnalysis and other aggregators show net debt in the several-hundred-million range. That means Conduent’s EV is meaningfully larger than its market cap. (StockAnalysis+1)
  • Liquidity: Management has emphasized cash on hand and the revolving credit facility as sources of near-term liquidity in SEC filings and the latest 10-Q/earnings commentary; operating cash flow is a key metric to watch as the company seeks to deleverage. The company stated it believes its cash, projected operating cash flow and its revolving credit line support near-term needs. (Conduent Investor+1)

Interpretation: Conduent is a balance-sheet–constrained turnaround: not insolvent, but carrying leverage that raises the bar for operational execution. If revenue growth stalls or free cash flow fails to materialize, debt servicing and refinancing risk become real constraints.

Income-statement & cash-flow highlights

  • Revenue trend: Revenues have been in the ~$3.3B range on an annual basis (2023–2024 levels per public filings and financial aggregators), with sequential quarter fluctuations due to contract timing and divestitures. Recent quarters in 2025 showed revenue in the mid-$700M range per quarter. (Yahoo Finance+1)
  • Profitability: GAAP results have cycled between losses and small profits in recent years; management prefers adjusted EBITDA/adjusted metrics that show margin improvement after restructuring. For investors, the question is whether adjusted profit improvement converts to consistent GAAP profitability and positive operating cash flow. (Conduent Investor+1)
  • Cash flow: Free-cash-flow generation has been variable. The company highlights projected cash flow from operations as a pillar of its liquidity, but historical net debt and working-capital swings mean investors should track quarterly cash-flow statements, not just headline operating results. (Conduent Investor+1)

Valuation and risks

  • Valuation: On a trailing basis Conduent’s P/E (when positive) and EV multiples are compressed versus stable peers because of the elevated leverage and inconsistent earnings. Market cap (sub-$500M range) compared with enterprise value near ~$1B indicates investors price in significant debt and execution risk. (Yahoo Finance+1)
  • Catalysts for upside: sustained adjusted-EBITDA growth, consistent GAAP profitability, meaningful free cash flow, and visible debt reduction would be strong upside catalysts. Contract wins or higher-margin mix (e.g., digital-services expansion) could improve investor sentiment. (Conduent Investor)
  • Downside risks: failure to convert adjusted metrics to real cash, large contract losses, macro pressure on customers (public-sector budgets, transportation spending shifts), or refinancing stress on debt.

Recommendation (straight answer)

  • For conservative investors: Conduent is not suitable. The balance sheet shows leverage and earnings volatility; until management demonstrably converts adjusted profits into recurring GAAP profits and consistent positive free cash flow, the stock is a speculative holding at best. (StockAnalysis+1)
  • For risk-tolerant investors / traders seeking gains: Conduent’s low absolute market cap and depressed share price create asymmetric upside if execution improves. That makes it a potential high-risk, event-driven trade — buy only a small allocation, be prepared for high volatility, and plan an exit strategy tied to specific milestones (e.g., two to three consecutive quarters of positive operating cash flow or a material debt-reduction announcement). Use strict position sizing and stop rules. (Conduent Investor)

What to watch next (actionable checklist)

  1. Quarterly cash-flow from operations (is it consistently positive?). (Conduent Investor)
  2. Net debt trend — any sustained debt paydown or refinancing on better terms. (StockAnalysis)
  3. Revenue mix — growth in higher-margin digital services vs. legacy BPO work. (Conduent Investor)
  4. Management commentary & guidance (next earnings call / 10-Q updates). (Conduent Investor+1)

Sources and Transparency

This article relied on Conduent’s investor relations releases and SEC filings, plus market data aggregators (Yahoo Finance, StockAnalysis, Macrotrends, Nasdaq) for pricing, market cap and historical financial statements. Key sources: Conduent investor releases and 10-Q/10-K filings, Yahoo Finance price & key statistics, and StockAnalysis balance-sheet pages. (StockAnalysis+3Conduent Investor+3Conduent Investor+3)


Bottom line: Conduent is a turnaround story with a leveraged balance sheet. If you believe management will convert improved adjusted margins into recurring cash and pay down debt, the stock offers speculative upside from a depressed base. If you require capital preservation and predictable returns, this is better left alone. Keep position sizing small, watch cash flow and net-debt trends, and tie any buy decision to concrete operational milestones. (Conduent Investor+1)


References

Conduent Incorporated. (2025, August 6). Conduent reports second quarter 2025 results [Press release]. Conduent Investor Relations. https://investor.conduent.com

Conduent Incorporated. (2025). Form 10-Q for the quarterly period ended June 30, 2025. U.S. Securities and Exchange Commission. https://www.sec.gov

Macrotrends LLC. (2025). Conduent balance sheet 2016–2025 (CNDT). Macrotrends. https://www.macrotrends.net

Nasdaq, Inc. (2025). Conduent Incorporated (CNDT) income statement. Nasdaq. https://www.nasdaq.com

StockAnalysis. (2025). Conduent (CNDT) financials, balance sheet & ratios. StockAnalysis. https://stockanalysis.com

Yahoo Finance. (2025). Conduent Incorporated (CNDT) stock price, quote, and news. Yahoo! Finance. https://finance.yahoo.com