VICI Properties: A 6.8% Dividend, Real-Estate Cash Machine & a Potential Swing-Trade Opportunity

VICI Properties Is More Than a Casino REIT

When investors hear VICI Properties Inc. (NYSE: VICI), the first thing that usually comes to mind is Las Vegas and for good reason. VICI owns the real estate behind some of the most recognizable gaming and entertainment properties in the country, including Caesars Palace Las Vegas, MGM Grand and the Venetian Resort Las Vegas.

But describing VICI as simply a “casino REIT” undersells the company.

VICI is an experiential real-estate investment trust that owns 103 properties across the United States and Canada, including 63 gaming properties and 40 other experiential properties. Its portfolio encompasses approximately 130 million square feet, 66,000 hotel rooms and more than 700 restaurants, bars, nightclubs and sportsbooks.

The company’s business model is particularly attractive from a cash-flow perspective: VICI generally owns the real estate while experienced operators run the businesses. Those operators pay VICI rent through long-term triple-net leases, meaning the tenants generally assume responsibility for property-level expenses such as taxes, insurance and maintenance.

That structure gives VICI something investors should appreciate: relatively predictable recurring rental revenue without having to operate the casinos itself.

And at today’s share price, that cash-flow model is becoming increasingly interesting.

The Regent casino hotel complex beside the sea at dusk
The Regent casino resort glows beside landscaped lagoons and the sea at dusk.

The Stock Is Trading at a Significant Discount to Its 52-Week High

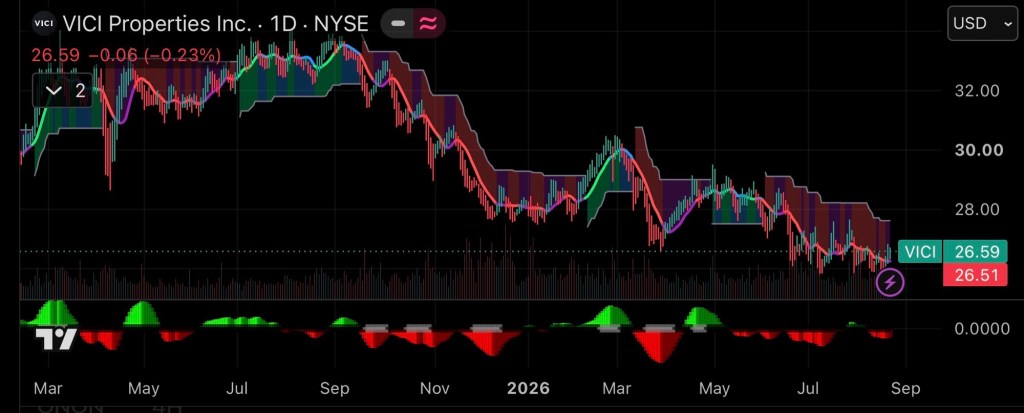
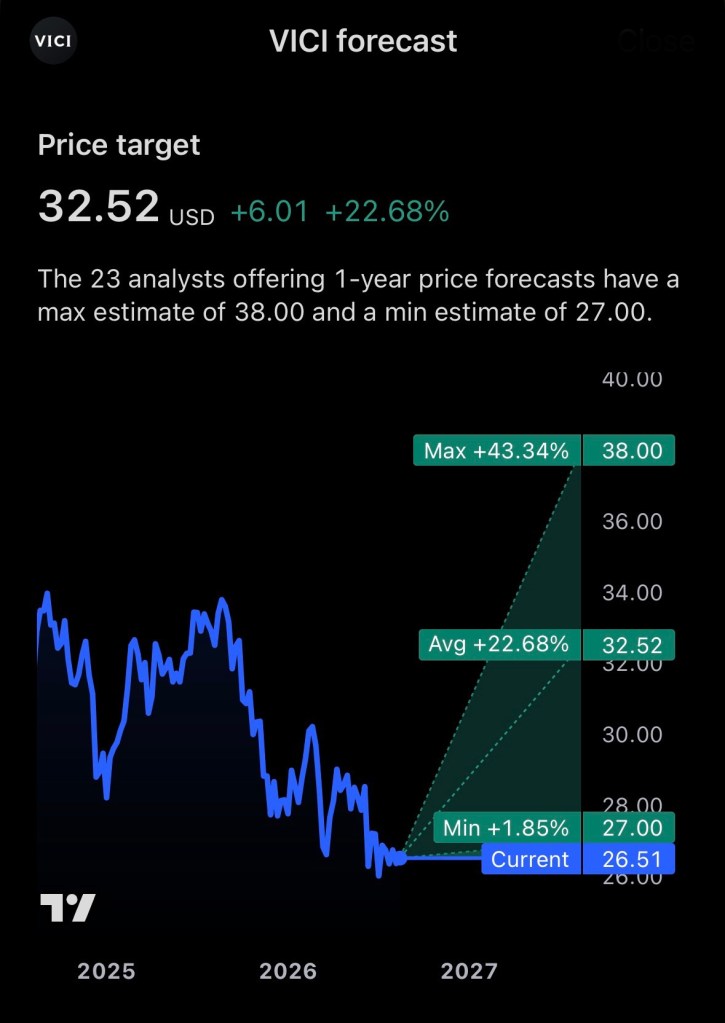
VICI closed around $26.51 on August 21, 2026, leaving the stock roughly 22% below its 52-week high of $33.92.

That decline is important because VICI’s underlying business has not collapsed.

Quite the opposite.

In its most recent quarter, VICI reported:

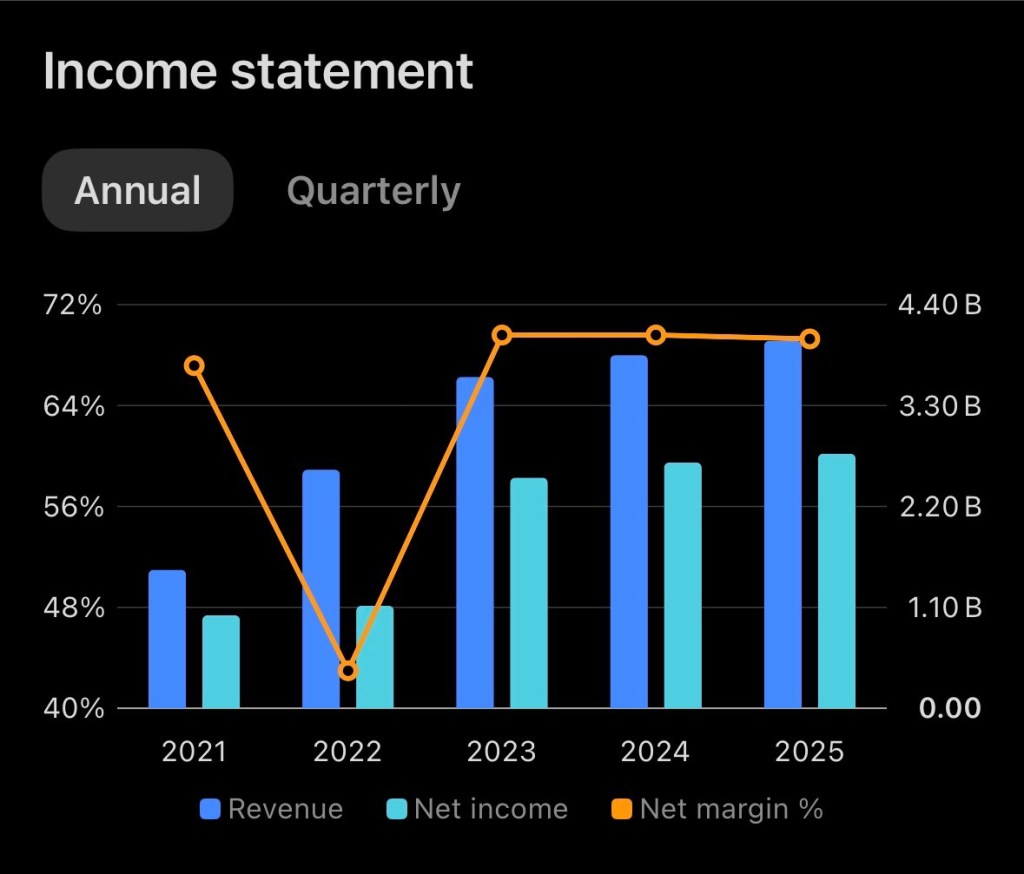
  • Revenue: approximately $1.1 billion, up 5.7% year over year
  • AFFO: $679.6 million, up 7.8%
  • AFFO per share: $0.62, up 4.6%
  • Full-year 2026 AFFO guidance: $2.45–$2.47 per share

AFFO- adjusted funds from operations is arguably the more important metric for a REIT investor because it provides a better picture of the recurring cash-generating capacity of the business than conventional GAAP earnings.

That distinction matters with VICI.

The company’s second-quarter GAAP net income fell sharply year over year, but management attributed much of the decline to a change in its non-cash credit-loss allowance. AFFO, meanwhile, increased.

In other words, the headline EPS number looks considerably worse than the underlying recurring cash-flow picture.

The Dividend Is the Big Attraction

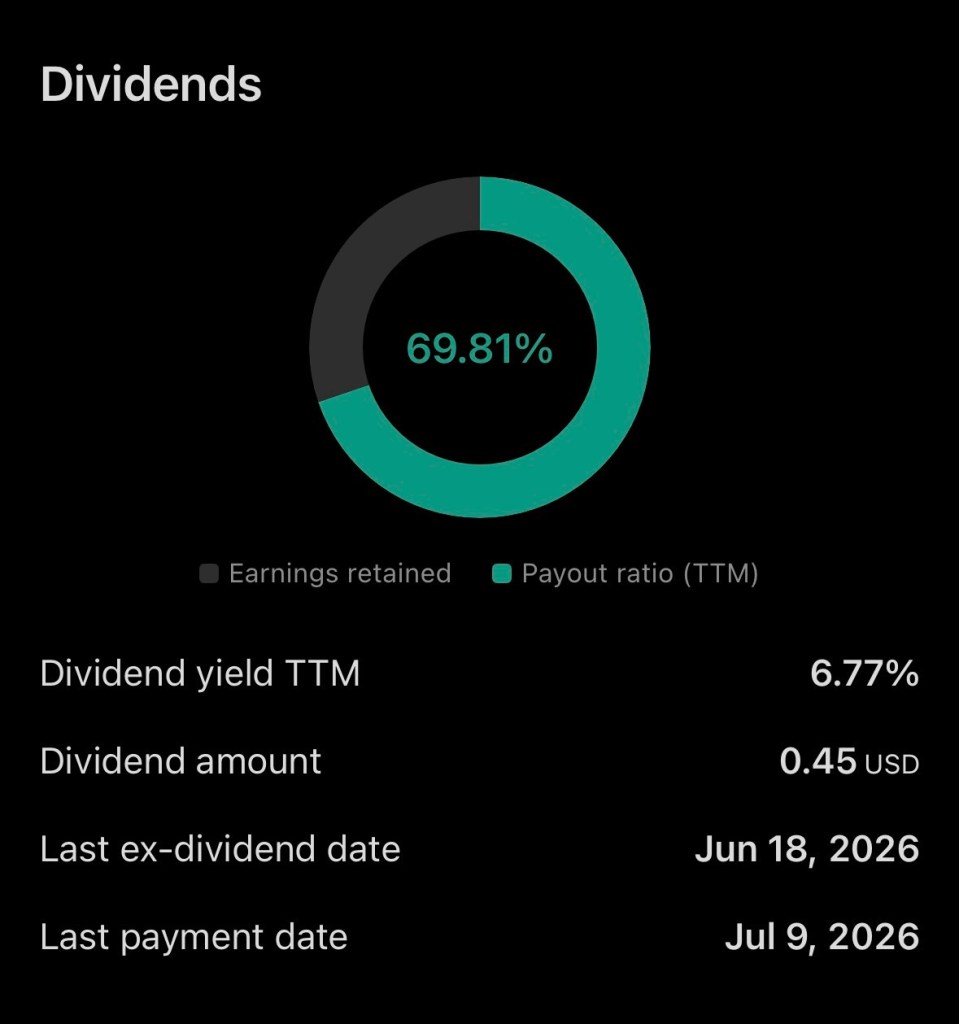
VICI currently pays a $0.45 quarterly dividend, or $1.80 annually if maintained at the current rate. The company has maintained the $0.45 quarterly payout through 2026.

At approximately $26.51 per share, that equates to a forward dividend yield of roughly:

$1.80 ÷ $26.51 = 6.79%

That’s a substantial yield for an S&P 500 company.

More importantly, VICI’s dividend has grown considerably since the company was formed. VICI’s annual dividend increased from $1.00 in 2018 to $1.77 in 2025, while the 2026 quarterly rate stands at $0.45.

Dividend Growth

YearAnnual Dividend
2018$1.00
2019$1.17
2020$1.26
2021$1.38
2022$1.50
2023$1.61
2024$1.70
2025$1.77
2026 annualized$1.80

Source: VICI Properties investor relations.

The growth rate has moderated as VICI has become larger, but the direction remains favorable.

Is the Dividend Covered?

This is where VICI gets particularly interesting.

Management’s 2026 AFFO guidance is $2.45–$2.47 per share. At a $1.80 annual dividend, the implied AFFO payout ratio is approximately 73%.

Using the midpoint of guidance:

$1.80 ÷ $2.46 = 73.2%

That leaves approximately 27% of AFFO per share above the current dividend.

For a REIT, that is a much more meaningful coverage measure than comparing the dividend with GAAP EPS.

It doesn’t mean the dividend is risk-free. VICI carries substantial debt, and REITs are particularly sensitive to interest rates and credit-market conditions. But the current payout appears reasonably supported by recurring AFFO.

VICI’s Growth Story Is Expanding Beyond Traditional Gaming

One of the more interesting aspects of VICI’s strategy is that management is trying to reduce the company’s dependence on traditional casino real estate.

During the second quarter, VICI added several important relationships.

The company welcomed Clairvest as its 14th tenant, Golden Entertainment as its 15th, and Club Med as its 16th tenant.

The Golden Entertainment transaction is particularly notable. VICI’s new Golden Entertainment Master Lease carries approximately $87 million in initial annual rent, a 30-year initial term and 2% annual rent escalators beginning in lease year three.

VICI also acquired the Carambola Beach Resort in St. Croix and plans to fund approximately $55.2 million of redevelopment through a build-to-suit arrangement with Club Med. The targeted reopening is in the fourth quarter of 2027.

That’s an important strategic development.

VICI isn’t abandoning gaming. Gaming remains its core competency.

But the company is increasingly attempting to become the landlord behind experiential destinations, including hospitality, wellness, golf and entertainment.

That potentially gives VICI a larger addressable market over time.

The Balance Sheet Is the Part Investors Should Watch

The biggest counterargument to the bullish VICI thesis is leverage.

As of June 30, 2026, VICI had approximately $17.2 billion of total debt and approximately $2.5 billion of liquidity, including cash and availability under its revolving credit facility.

That is not insignificant.

A REIT with substantial debt can perform very well when interest rates cooperate, but higher rates increase the cost of refinancing and can reduce the relative attractiveness of REIT yields compared with bonds and other fixed-income investments.

The good news is that VICI has continued to demonstrate access to capital and has been using interest-rate swaps to manage some future interest-rate exposure. As of June 30, the company had entered into $600 million of forward-starting interest-rate swaps.

The bad news is simple:

VICI doesn’t need a business crisis to underperform. Higher-for-longer interest rates alone can pressure the valuation.

That is one reason the stock can offer a nearly 7% yield while still trading at a discount to its previous highs.

What About a Swing Trade?

This is where VICI gets especially interesting.

VICI isn’t typically thought of as a swing-trading stock. It is a relatively mature REIT designed more for income and total return.

But that doesn’t mean it can’t be traded.

At approximately $26.51, the stock is sitting substantially below its prior $33.92 high.

Wall Street’s valuation suggests the market may have become too pessimistic. Current analyst estimates vary, but several consensus sources place the average 12-month target around $31–$33, with some targets as high as $38.

That creates an interesting setup.

A Potential Swing-Trade Framework

Entry zone: approximately $25.75–$26.50

Initial target: approximately $28.50–$30.00

Secondary target: approximately $31–$32.50

Bull-case target: approximately $33–$34

Risk-management level: roughly $24.50–$25.00, depending on the trader’s risk tolerance and confirmation of a breakdown.

These aren’t guaranteed support and resistance levels; they’re a framework based on the stock’s recent trading range, prior price behavior and current valuation.

The key technical question is whether VICI can establish a sustained move above the $27–$28 area.

If it can, the next move toward $30 becomes considerably more interesting.

If the stock instead loses the mid-$25 area on heavy volume, the swing-trade thesis weakens and investors should be prepared for another leg lower.

The Dividend Creates an Interesting Trading Dynamic

There’s another reason VICI is different from many swing trades.

A trader buying VICI isn’t simply betting on price appreciation.

At the current annualized dividend, an investor receives approximately 6.8% annualized income while waiting for the market to recognize the potential valuation opportunity.

For example, a hypothetical $10,000 investment at $26.51 would purchase approximately 377 shares.

At $1.80 per share annually, those shares would generate approximately:

$679 per year in dividends

before taxes, assuming the dividend remains unchanged.

If VICI subsequently rose from $26.51 to $30:

  • Capital gain: approximately $1,316
  • Annual dividend income: approximately $679
  • Potential combined one-year return: approximately $1,995, or roughly 20%

That’s not a forecast. It’s simply an illustration of why a high-yield REIT can offer an attractive total-return setup when bought at a depressed valuation.

The Risks Should Not Be Ignored

The bullish case is compelling, but VICI isn’t a risk-free 7% yield.

1. Interest-rate risk

REIT valuations can suffer when Treasury yields rise because investors demand a higher yield from real estate securities.

2. Leverage

Approximately $17.2 billion of debt means refinancing costs and credit-market conditions matter.

3. Tenant concentration

Although VICI is diversifying its tenant base, gaming remains central to the portfolio. The financial health of major operators remains important to VICI’s rent collection.

4. Gaming-cycle risk

Casino and entertainment spending is discretionary. A recession or deterioration in consumer spending could negatively affect tenants.

5. Regulatory risk

Gaming is heavily regulated. VICI’s tenants must maintain the necessary licenses and regulatory approvals to operate their properties.

6. Dividend-growth moderation

The dividend is attractive, but investors shouldn’t assume the double-digit dividend-growth rates VICI achieved earlier in its history will continue indefinitely.

VICI itself highlights interest rates, tenant credit risk, gaming-industry conditions, regulation, leverage and economic conditions among the factors that could materially affect future results.

My Take: VICI Looks More Interesting at $26.50 Than It Did at $34

At approximately $26.51, VICI presents an unusual combination:

A high-quality experiential real estate portfolio + long-term leases + growing AFFO + a nearly 7% dividend yield + a stock price more than 20% below its 52-week high.

The market is clearly demanding a risk premium.

And investors should understand why.

The company has significant debt, remains exposed to interest rates and still derives substantial economics from the gaming industry.

But the latest operating numbers don’t suggest a deteriorating business.

Second-quarter AFFO per share increased 4.6%, management raised the low end of its 2026 AFFO guidance, and the company continues to expand its tenant base and experiential real-estate footprint.

At $26.51, VICI trades at roughly 10.8 times the midpoint of management’s 2026 AFFO guidance.

That’s a valuation I find considerably more compelling than the stock’s previous $33–$34 range.

Bottom Line

For income investors: VICI’s approximately 6.8% yield and roughly 73% AFFO payout ratio make the stock worth serious consideration for a diversified income portfolio.

For value investors: The stock’s discount from its 52-week high combined with growing AFFO creates an attractive risk/reward profile if interest-rate pressures ease.

For swing traders: The $25.75–$26.50 area offers an intriguing entry zone, with $28.50–$30 representing a reasonable first profit-taking region and $31–$33 providing a larger upside target if momentum improves.

My overall view: VICI is more attractive as a buy-and-hold income/total-return position than as a pure short-term trade but the current valuation creates a legitimate swing-trade opportunity as well.

The most important catalyst to watch isn’t simply the next dividend.

It’s whether AFFO continues growing while interest-rate pressure on REIT valuations begins to fade.

If those two variables move in VICI’s favor, today’s $26–$27 price could eventually look like an attractive entry point in hindsight.


Investor Disclosure

Disclosure: I own a position in VICI Properties (VICI). This article reflects my personal analysis and is intended for informational and educational purposes only. It is not a recommendation to buy, sell or hold VICI or any other security. I may have a financial interest in the outcome of the analysis. Investors should conduct their own due diligence and consider their individual financial objectives, risk tolerance and investment horizon before making investment decisions.


References

MarketBeat. (2026, July 29). VICI Properties Inc. issues FY 2026 earnings guidance. MarketBeat source

MarketBeat. (2026). VICI Properties (VICI) stock forecast and price target 2026. MarketBeat analyst consensus

MarketScreener. (2026). VICI Properties, Inc.: Target price consensus and analysts recommendations. MarketScreener consensus data

U.S. Securities and Exchange Commission. (2026). VICI Properties Inc. and VICI Properties L.P. annual report on Form 10-K for the year ended December 31, 2025. SEC filing

VICI Properties Inc. (2026, February 25). VICI Properties Inc. announces fourth quarter and full year 2025 results. VICI Properties investor relations

VICI Properties Inc. (2026, July 29). VICI Properties Inc. announces second quarter 2026 results. VICI Properties second-quarter 2026 results

VICI Properties Inc. (2026). Dividends & tax information. VICI Properties dividend information

VICI Properties Inc. (2026). Historical price lookup. VICI Properties historical price data

Understanding Auto Insurance Cancellations: Pro-Rata, Short-Rate, and Flat Cancellations Explained

Auto insurance policies are not always kept for their full term. Whether a policyholder sells a vehicle, finds a better rate, moves to another state, or simply decides to switch carriers, insurance policies are often canceled before their expiration date.

What many consumers don’t realize is that not all cancellations are calculated the same way. Depending on who initiates the cancellation and when it occurs, the refund amount may vary significantly.

The three most common types of auto insurance cancellations are Pro-Rata, Short-Rate, and Flat Cancellations.

What Is a Pro-Rata Cancellation?

A pro-rata cancellation occurs when the insurance company cancels the policy or when a cancellation is processed without any penalty.

Under a pro-rata cancellation, the policyholder receives a refund for all unused premium on a straight-line basis.

Example

Assume:

  • Annual premium: $1,200
  • Policy term: 12 months
  • Policy canceled after 3 months

The policyholder used 25% of the coverage period and is entitled to a refund of the remaining 75%.

  • Premium paid: $1,200
  • Earned premium: $300
  • Refund: $900

No cancellation fee is deducted.

Common Reasons for Pro-Rata Cancellations
  • Insurance company non-renews or cancels coverage
  • Vehicle is totaled and coverage ends
  • State regulatory requirements mandate a full refund calculation
  • Certain carrier-specific cancellation provisions

What Is a Short-Rate Cancellation?

A short-rate cancellation is the most common form of cancellation when the policyholder voluntarily cancels coverage before the policy expires.

With a short-rate cancellation, the insurer retains slightly more premium than the exact amount earned. This creates a financial penalty intended to offset administrative costs associated with issuing and canceling the policy.

Example

Assume:

  • Annual premium: $1,200
  • Policy canceled after 3 months
  • Unearned premium: $900

Instead of receiving the full $900 refund, the carrier applies a short-rate penalty.

Potential refund:

  • Unearned premium: $900
  • Short-rate penalty: $45
  • Refund issued: $855

The exact penalty varies by carrier and state regulations.

Typical Short-Rate Fees

Many carriers use:

  • 5% of the unearned premium
  • 10% of the unearned premium
  • A fixed cancellation fee ranging from $25 to $75
  • A state-approved short-rate table
Why Insurers Use Short-Rate Cancellations

Insurance companies incur expenses when policies are issued, including:

  • Underwriting costs
  • Policy processing
  • Commission payments
  • Administrative expenses

Short-rate penalties help recover a portion of those costs when a customer leaves before the policy term ends.

What Is a Flat Cancellation?

A flat cancellation treats the policy as though it never existed.

The insurer returns 100% of the premium paid and no coverage is considered to have been in force.

Example

Assume:

  • Annual premium: $1,200
  • Policy purchased today
  • Customer discovers duplicate coverage and cancels before the policy effective date

Refund:

  • Premium paid: $1,200
  • Refund issued: $1,200

No premium is earned by the insurer.

Common Reasons for Flat Cancellations
  • Policy canceled before the effective date
  • Coverage obtained in error
  • Duplicate policies discovered
  • Underwriting declines coverage before policy inception
  • No claims or coverage exposure occurred

Comparing the Three Types of Cancellations

Cancellation TypeRefund MethodPenalty Applied?Typical Situation
Flat Cancellation100% refundNoPolicy never takes effect
Pro-RataRefund of unused premiumNoInsurer initiates cancellation
Short-RateRefund of unused premium minus feeYesCustomer voluntarily cancels

How Much Could Cancellation Fees Cost?

Consider a policy with a remaining unearned premium of $600:

MethodRefund
Flat Cancellation$600
Pro-Rata Cancellation$600
Short-Rate (5% Penalty)$570
Short-Rate (10% Penalty)$540
Short-Rate + $50 Fee$550

While the difference may seem small, policyholders with higher premiums can lose hundreds of dollars when a short-rate penalty applies.

What Consumers Should Do Before Canceling

Before switching auto insurance companies:

  1. Verify the effective date of your new policy.
  2. Ask your current carrier whether a short-rate penalty applies.
  3. Request the exact refund amount in writing.
  4. Confirm there are no cancellation fees.
  5. Avoid any lapse in coverage that could increase future insurance premiums.

Many consumers focus solely on the new premium savings and overlook cancellation penalties that can reduce the benefit of switching carriers.

Silver sedan under transparent garage model on October 2023 calendar with service dates
A silver car under a transparent garage model on an October 2023 calendar.

The Takeaway Here

Understanding the difference between flat, pro-rata, and short-rate cancellations can help consumers make more informed decisions when changing auto insurance coverage. While flat and pro-rata cancellations generally provide the greatest refund, short-rate cancellations may reduce the amount returned through penalties or administrative fees.

Before canceling any auto policy, ask your insurance company or agent how the refund will be calculated. A simple phone call could prevent an unexpected deduction and help ensure a smooth transition to your new coverage.

Disclosure: This article is intended for educational purposes only. Cancellation rules, refund calculations, and fees vary by insurance carrier and state regulations. Consumers should consult their insurance policy and carrier for specific cancellation provisions.

About the Author:

David Dandaneau is a client relations analyst that covers the insurance and financial services industry. He is known for his insightful analysis and comprehensive coverage of market trends and regulatory developments.

Enterprise Products Partners (EPD): High-Yield Stability Meets Measured Growth in 2026

Enterprise Products Partners L.P. (NYSE: EPD), one of the largest midstream energy operators in North America, continues to attract income-focused investors in 2026 with a combination of steady cash flows, a strong dividend track record, and modest but reliable growth prospects.

Power plant with cooling towers and electrical substation with transmission lines at sunset
A power plant surrounded by transmission towers during a vibrant sunset

Stock Performance and Current Price

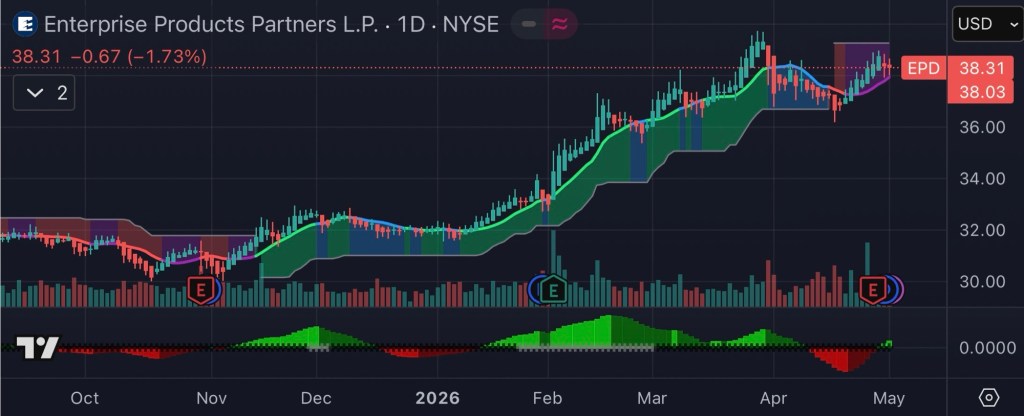
As of late April 2026, EPD shares are trading in the mid-to-high $30 range (approximately $36–$38 per unit), slightly below analyst consensus targets near $39.50.

The stock has demonstrated resilience this year, gaining over 20% year-to-date amid improving fundamentals and renewed investor interest in energy infrastructure assets.

Despite some short-term volatility and minor earnings misses, the broader trend remains constructive, supported by stable demand for oil, natural gas liquids (NGLs), and export services.

Dividend Profile: A Core Income Play

Enterprise Products Partners remains a standout in the income investing space:

  • Annual distribution: ~$2.20 per unit
  • Quarterly payout: $0.55
  • Dividend yield: ~5.8%–6.0%
  • Dividend growth streak: 28 consecutive years

The company recently reaffirmed its quarterly distribution for 2026, reflecting a ~2–3% year-over-year increase, consistent with its conservative capital return strategy.

Unlike high-growth equities, EPD prioritizes distribution stability and coverage, maintaining payout ratios supported by strong operating cash flow.

Financial Strength and Operational Momentum

Recent earnings and operational data highlight steady performance:

  • Q1 2026 EBITDA: ~$2.7 billion
  • Operating income growth: +8%
  • Revenue beat expectations despite EPS miss

Enterprise’s diversified asset base spanning pipelines, storage, processing, and export terminals continues to generate predictable fee-based income, insulating the business from commodity price volatility.

Growth Outlook: Moderate in 2026, Stronger Beyond

Looking ahead, analysts expect measured growth in 2026, with stronger acceleration into 2027:

  • 2026 outlook: Transitional year with stable cash flow
  • 2027+: Potential double-digit EBITDA and cash flow growth as new projects come online
  • Capital projects pipeline: ~$6 billion in infrastructure investments

Wall Street forecasts also indicate gradual earnings expansion:

  • 2026 estimated earnings: ~$6.1B
  • 2027 estimated earnings: ~$6.8B

This positions EPD as a “slow compounder” rather than a high-growth equity ideal for long-term income portfolios.

Key Investment Highlights

MetricValue / Insight
Current Stock Price~$36–$38
Dividend Yield~5.8%–6.0%
Annual Distribution~$2.20
Dividend Growth Streak28 years
2026 Stock Performance~+20% YTD
EBITDA (Q1 2026)~$2.7B
Growth OutlookModerate 2026, stronger 2027+
Analyst Target~$39.50

Investment Thesis

Enterprise Products Partners continues to deliver on its core value proposition: reliable income with low volatility and gradual capital appreciation.

Bull Case:

  • Durable, fee-based midstream business model
  • Strong balance sheet and distribution coverage
  • High yield relative to broader equity markets
  • Visible long-term growth pipeline

Bear Case:

  • Limited near-term upside due to mature asset base
  • Slower dividend growth compared to peers
  • Sensitivity to energy demand cycles and interest rates

Bottom Line

For 2026, Enterprise Products Partners is best viewed as a defensive income vehicle rather than a growth stock. Investors seeking consistent yield and stability in uncertain markets may find EPD particularly attractive, while those pursuing aggressive capital gains may look elsewhere.

With a near-6% yield, a decades-long dividend track record, and improving long-term growth catalysts, EPD remains a cornerstone holding in the midstream energy sector.

Disclosure Statement

Disclosure: The author currently holds a position in Enterprise Products Partners L.P. (NYSE: EPD). This article is for informational purposes only and should not be considered financial advice. Investors should conduct their own due diligence or consult a licensed financial professional before making investment decisions.


References (APA Format)

Yahoo Finance. (2026). Enterprise Products Partners L.P. (EPD) stock price, news, and analysis. Retrieved May 2, 2026, from https://finance.yahoo.com/

MarketBeat. (2026). Enterprise Products Partners dividend history and yield. Retrieved May 2, 2026, from https://www.marketbeat.com/

Simply Wall St. (2026). Enterprise Products Partners distribution updates and analysis. Retrieved May 2, 2026, from https://simplywall.st/

Intellectia. (2026). Enterprise Products Partners starts 2026 strong with stock gains. Retrieved May 2, 2026, from https://intellectia.ai/

The Motley Fool. (2026). Energy dividend stocks outlook and analysis. Retrieved May 2, 2026, from https://www.fool.com/

Seeking Alpha. (2026). Enterprise Products Partners: Growth outlook and capital projects. Retrieved May 2, 2026, from https://seekingalpha.com/

WallStreetZen. (2026). EPD stock forecast and earnings projections. Retrieved May 2, 2026, from https://www.wallstreetzen.com/

Why NVIDIA Stock is a Smart Long-Term Investment

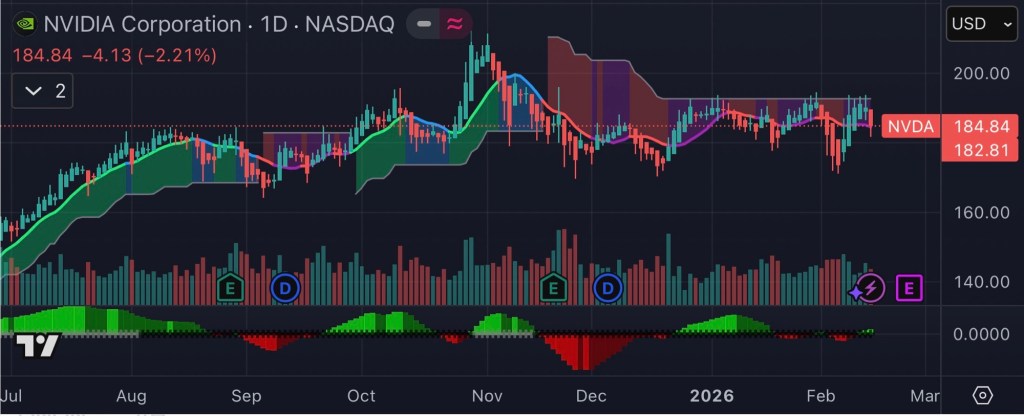
Despite recent volatility and short-term investor hesitation, NVIDIA (NASDAQ: NVDA) remains one of the strongest long-term investment opportunities in the global equity market. While the stock has experienced periods of consolidation and suppressed price action relative to its explosive growth, its financial performance, industry dominance, and forward cash flow trajectory suggest that current levels could represent a compelling entry point for long-term investors.


NVIDIA’s Financial Strength Remains Unmatched

NVIDIA’s growth over the past two years has been historic. The company reported $130.5 billion in fiscal 2025 revenue, up 114% year-over-year, along with net income of $72.9 billion, demonstrating extraordinary profitability.

This growth has accelerated further into fiscal 2026:

  • Q3 FY2026 revenue reached $57.0 billion, up 62% year-over-year.
  • Quarterly net income surged to $31.9 billion, representing exceptional margin strength.
  • NVIDIA expects continued momentum, projecting approximately $54 billion in quarterly revenue, indicating sustained demand.

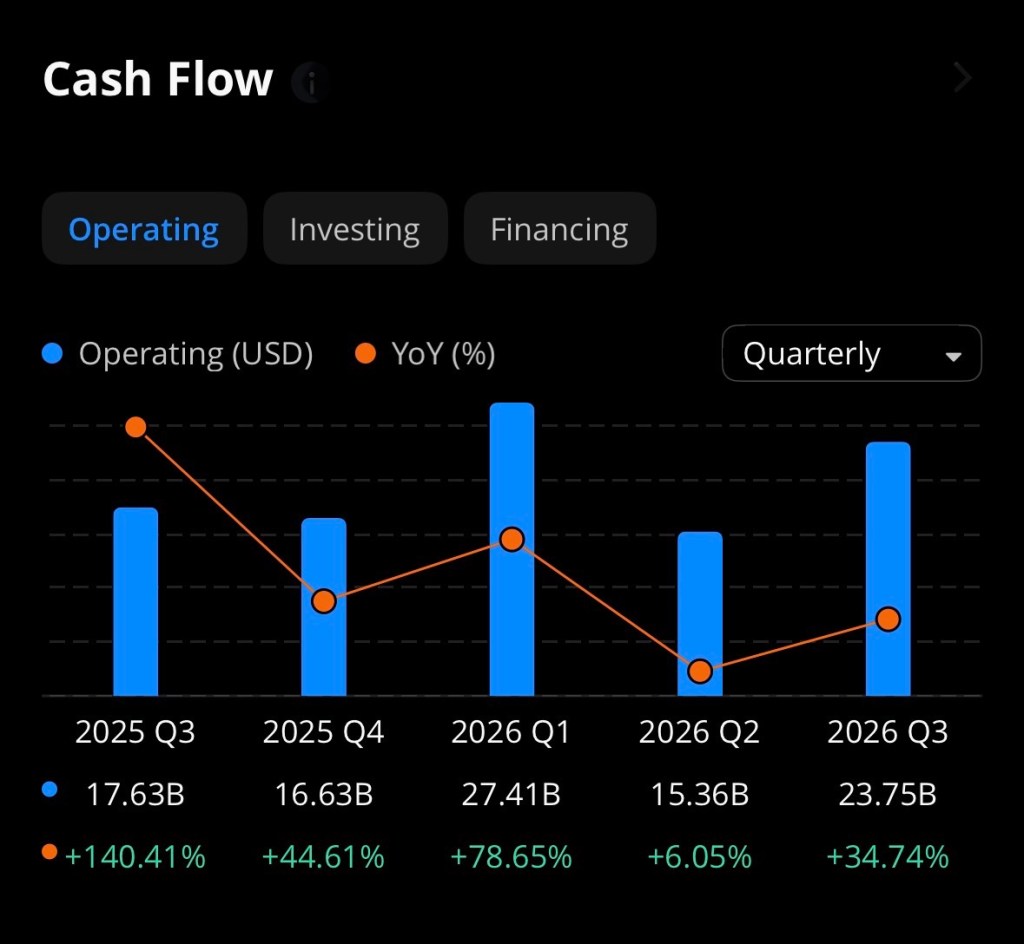
This performance translates directly into massive operating cash flow potential. With operating margins above 60% in recent quarters and explosive AI-related demand, NVIDIA is converting an unusually high percentage of revenue into free cash flow.


AI Demand Is Still in Its Early Stages

The most critical investment thesis for NVIDIA is its central role in powering artificial intelligence infrastructure globally.

Major technology companies are expected to spend over $650 billion on AI infrastructure in 2026, benefiting NVIDIA directly as the primary supplier of advanced GPUs.

Additionally:

  • NVIDIA’s data center segment generated over $51 billion in quarterly revenue, driven primarily by AI demand.
  • Analysts project NVIDIA’s data center revenue alone could reach $300 billion annually by fiscal 2027, reflecting extraordinary long-term growth potential.

This positions NVIDIA not simply as a semiconductor company, but as the foundational infrastructure provider for the global AI economy.


Why the Stock Appears “Suppressed” Despite Strong Fundamentals

NVIDIA’s stock consolidation is primarily driven by macro and investor psychology not deteriorating fundamentals.

Key factors include:

1. Massive Prior Gains Created Consolidation Period

After rising over 1,000% in recent years, periods of sideways movement are normal as valuation multiples normalize.

2. Investor Concerns About AI Spending Sustainability

Some investors worry large capital expenditures from tech giants could reduce near-term cash flow.

However, these investments are directly fueling NVIDIA’s revenue growth.

3. Emerging Competition

Companies like AMD, Broadcom, and custom chips from hyperscalers are increasing competition, but NVIDIA maintains a dominant performance and software ecosystem advantage.


Estimated Cash Flow Comparison: NVIDIA vs Competitors (2026 Projection)

Based on revenue guidance, historical free cash flow margins, and analyst projections, NVIDIA is expected to dramatically outperform competitors in absolute cash flow generation.

CompanyEstimated 2026 RevenueEstimated FCF MarginEstimated 2026 Free Cash FlowAI Market Position
NVIDIA$240B–$280B45%–55%$110B–$150BDominant leader
AMD$45B–$60B20%–25%$9B–$15BStrong competitor
Broadcom$65B–$75B35%–40%$23B–$30BGrowing AI custom chips
Intel$55B–$65B10%–20%$6B–$12BRecovery phase
Qualcomm$42B–$48B25%–30%$11B–$14BMobile AI niche

Methodology:
Estimates derived from:

  • Company financial statements
  • Forward guidance
  • Historical free cash flow conversion ratios
  • AI growth projections

Competitive Advantage: NVIDIA’s True Moat Is Software, Not Just Chips

NVIDIA’s competitive edge extends beyond hardware into software ecosystems such as CUDA, which creates lock-in effects across millions of developers.

Additionally:

  • NVIDIA’s GPUs remain superior for training large AI models.
  • The company continues rapid innovation with new Blackwell and next-generation AI architectures.

This creates extremely high switching costs for customers.


Valuation Opportunity: Cash Flow Suggests Undervaluation

If NVIDIA generates $130 billion in annual free cash flow within the next 2–3 years, even a conservative valuation multiple of 30x FCF would imply:

Potential future valuation:

$130B × 30 = $3.9 trillion market cap

Compared to today’s lower valuation levels, this represents substantial upside potential.


Long-Term Investment Thesis: Why NVIDIA Remains a Buy

Key bullish factors:

1. AI Demand Is Still in Early Stages
Global AI adoption is accelerating, not slowing.

2. Massive Free Cash Flow Generation
Few companies in history have generated cash flow at NVIDIA’s scale.

3. Dominant Market Position
NVIDIA remains the undisputed leader in AI computing infrastructure.

4. Strong Shareholder Returns
The company has already returned $37 billion to shareholders through buybacks and dividends in FY2026 alone.

5. Long-Term Secular Tailwind
AI is expected to reshape every industry over the next decade.


Risks Investors Should Monitor

No investment is risk-free. Key risks include:

  • Increased competition from AMD, Broadcom, and hyperscalers
  • Government export restrictions
  • Potential slowdown in hyperscaler spending
  • Valuation volatility due to macroeconomic conditions

However, none of these risks currently undermine NVIDIA’s dominant position.


Conclusion: Suppressed Prices May Represent a Rare Opportunity

NVIDIA remains one of the most financially powerful and strategically positioned companies in the world. Despite short-term stock volatility, its explosive revenue growth, dominant AI position, and unprecedented free cash flow generation suggest that current price consolidation may represent one of the most attractive long-term entry opportunities available.

For investors with a multi-year horizon, NVIDIA remains a cornerstone asset in the AI-driven future economy.


Disclosure:
The author does not currently own, directly or indirectly, any shares, options, or other financial interests in NVIDIA Corporation (NASDAQ: NVDA) at the time of publication. This article is provided for informational and educational purposes only and does not constitute financial, investment, or trading advice. Investors should conduct their own research and consult with a licensed financial professional before making any investment decisions.

References

Barron’s. (2026, February). Nvidia stock rises. Broadcom is closing the AI chips gap. Retrieved from https://www.barrons.com

Barron’s. (2026, February). Nvidia stock pops. It should benefit from OpenAI spending. Retrieved from https://www.barrons.com

MarketWatch. (2026, February). Microsoft’s stock is cheaper than IBM’s for the first time in a decade. Retrieved from https://www.marketwatch.com

NVIDIA Corporation. (2025). NVIDIA announces financial results for fourth quarter and fiscal 2025. Retrieved from https://nvidianews.nvidia.com

NVIDIA Corporation. (2025). NVIDIA announces financial results for second quarter fiscal 2026. Retrieved from https://nvidianews.nvidia.com

NVIDIA Corporation. (2025). NVIDIA announces financial results for third quarter fiscal 2026. Retrieved from https://nvidianews.nvidia.com

NVIDIA Corporation. (2025). NVIDIA announces financial results for first quarter fiscal 2026. Retrieved from https://nvidianews.nvidia.com

Tom’s Hardware. (2025, December). Nvidia’s revenue skyrockets to record $57 billion per quarter. Retrieved from https://www.tomshardware.com


Conagra Brands ($CAG): High Dividend Yield and Depressed Valuation Create a Compelling Income Opportunity

February 7, 2026

Conagra Brands, Inc. (NYSE: CAG), one of America’s largest packaged food companies and owner of iconic brands such as Birds Eye, Slim Jim, Healthy Choice, and Marie Callender’s, has emerged as a compelling investment candidate for income-focused investors. Despite recent operational challenges and declining share price performance, the company’s unusually high dividend yield, stable cash flows, and historically low valuation may present an attractive risk-reward profile for long-term investors willing to tolerate near-term volatility.


Current Stock Price and Market Position

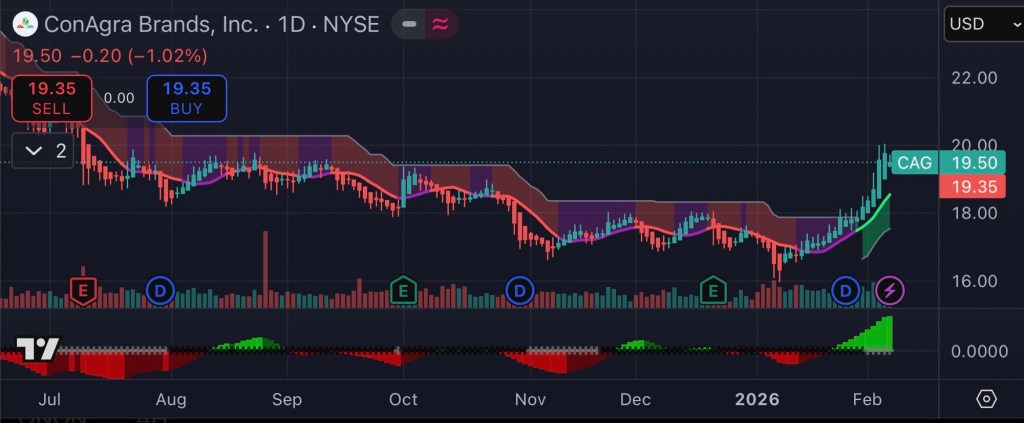
As of early February 2026, Conagra Brands shares are trading at approximately $19.55 per share, near the lower end of their 52-week range of $15.96 to $28.52. The company currently carries a market capitalization of roughly $8.8–$8.9 billion and generates annual revenue of approximately $11.23 billion, underscoring its significant presence in the consumer staples sector.

However, the stock has declined more than 26% over the past year, reflecting investor concerns about declining sales volume, rising costs, and shifting consumer preferences.

While these headwinds have weighed on investor sentiment, they have also created a rare combination of depressed valuation and elevated income potential.


Dividend Yield: A Major Strength for Income Investors

Conagra Brands’ most compelling investment characteristic is its dividend.

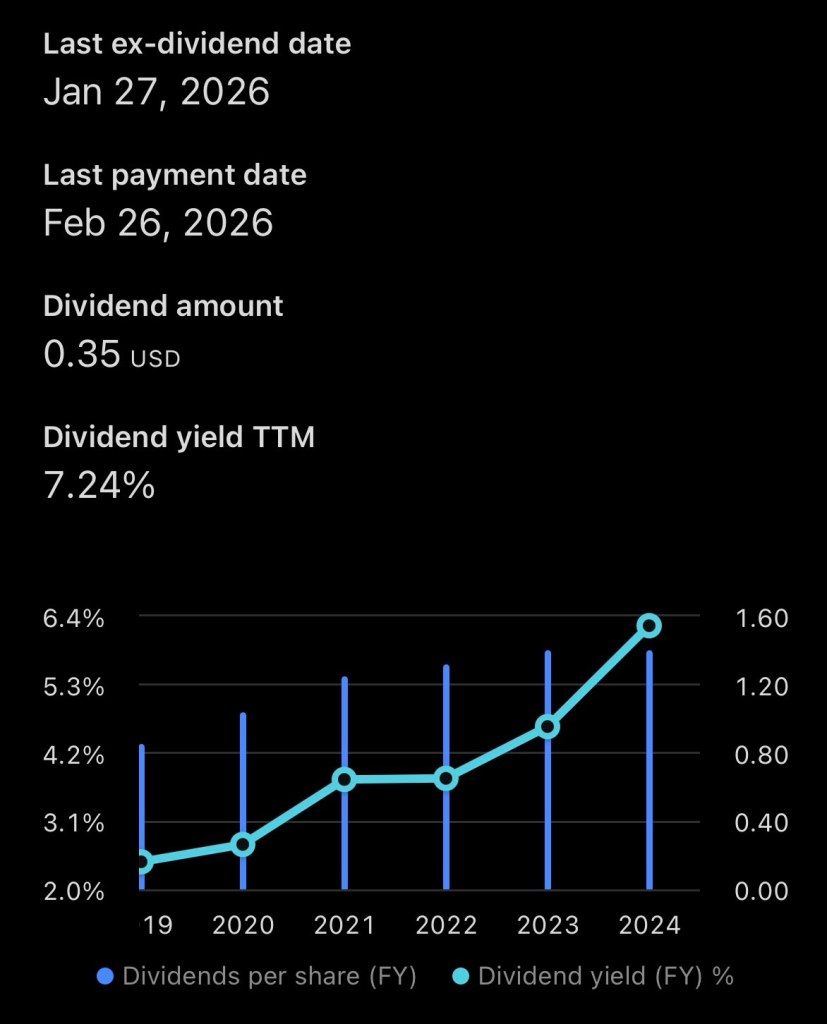
  • Annual dividend: $1.40 per share
  • Dividend yield: Approximately 7.16% to 7.89% depending on price fluctuations
  • Dividend payout frequency: Quarterly
  • Dividend history: Over 160 dividend payments since 1985

This yield is significantly higher than the broader S&P 500 average, which typically ranges between 1.5% and 2.0%.

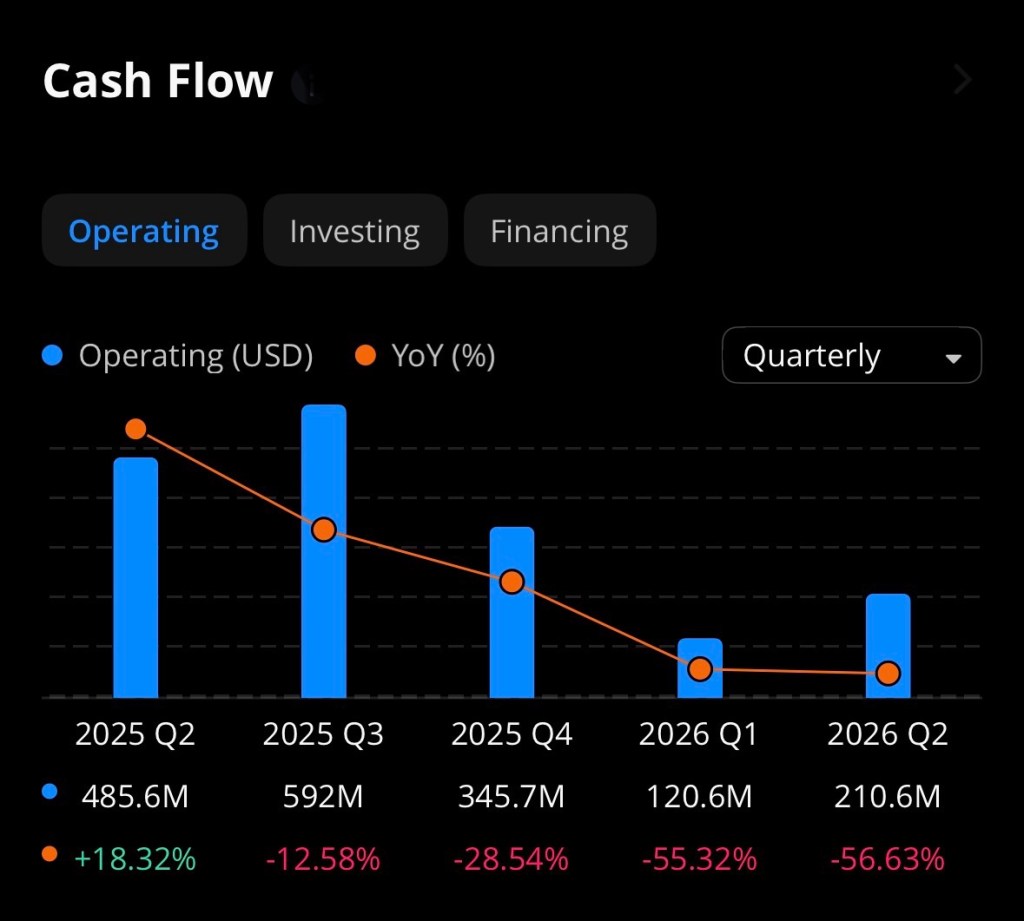
Even more importantly, Conagra generates strong free cash flow—approximately $1.14 billion annually—which supports its dividend payments and enhances their sustainability.

The company’s dividend payout ratio based on forward estimates ranges between 45% and 59% of cash flow, indicating the dividend is supported by underlying earnings power rather than excessive borrowing.

For investors seeking income, this dividend alone provides substantial annual returns regardless of stock price appreciation.


Valuation: Historically Low Price Creates Opportunity

One of the most compelling reasons investors may consider Conagra today is its relatively low valuation.

Key valuation metrics include:

  • Forward price-to-earnings ratio: Approximately 10.4
  • Free cash flow yield: 13.4%
  • Book value per share: $18.64 (close to current share price)

These metrics suggest the stock is trading near its intrinsic asset value, with investors effectively paying a modest premium for a business that generates over $1 billion annually in free cash flow.

Historically, consumer staples companies trade at higher multiples due to their predictable cash flows and defensive characteristics. A forward P/E ratio near 10 places Conagra at a meaningful discount compared to many peers.


Cash Flow and Financial Strength Support Long-Term Stability

Despite near-term earnings pressures, Conagra remains fundamentally profitable and cash-generating.

Financial highlights include:

  • Operating cash flow: $1.54 billion annually
  • Free cash flow: $1.14 billion annually
  • Gross margin: 25.5%
  • Operating margin: 13.83%

These metrics demonstrate that even in a challenging economic environment, Conagra continues to generate meaningful profit margins.

Consumer staples companies like Conagra also tend to be more resilient during economic downturns, as demand for packaged food remains relatively stable regardless of broader economic conditions.


Recent Challenges Have Created Opportunity

Recent operational challenges have contributed to the stock’s decline, including:

  • Volume declines due to inflation-sensitive consumers
  • Rising raw material costs, particularly meat prices
  • Impairment charges and slower growth expectations

However, these challenges appear cyclical rather than structural.

Importantly, Conagra has reaffirmed its long-term outlook and continues investing in efficiency improvements, pricing strategies, and portfolio optimization.


Analyst Price Target and Future Outlook

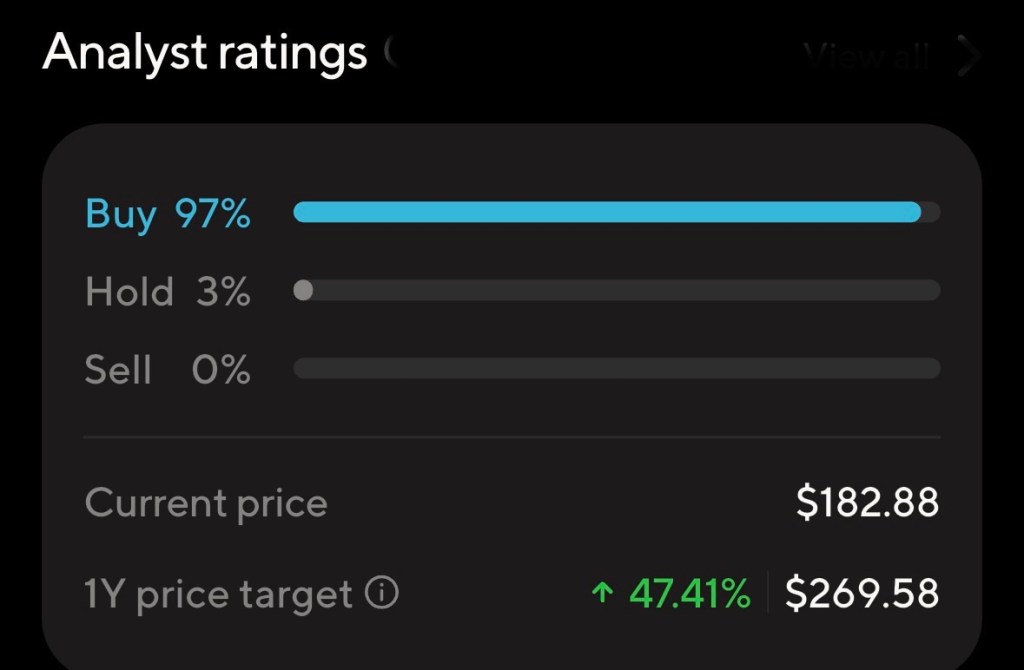
Wall Street analysts currently maintain an average price target of approximately $20.58, representing potential upside of about 16% from current levels.

Even more conservative targets suggest modest appreciation potential, while income investors collect a substantial dividend while waiting.

Reasonable 12-Month Price Projection

Based on:

  • Historical valuation multiples
  • Dividend yield normalization
  • Improving cost pressures
  • Stable consumer demand

A realistic one-year price range for Conagra Brands is:

Base Case: $20–$23
Bull Case: $24–$26
Bear Case: $17–$19

In addition to capital appreciation, investors could receive approximately 7% annual income, significantly enhancing total returns.


Total Return Potential: Combining Dividend and Price Recovery

If shares rise from $19.55 to $22.50 over the next year:

  • Capital gain: ~15%
  • Dividend yield: ~7%
  • Total return potential: ~22%

This level of total return potential is unusually high for a defensive consumer staples company.


Why Conagra Brands May Be a Strong Investment Choice

Key investment strengths include:

1. Exceptionally High Dividend Yield
Nearly 7–8%, far above market averages.

2. Strong Cash Flow Generation
Over $1 billion annually supports dividend sustainability.

3. Low Valuation Relative to Cash Flow and Assets
Forward P/E near 10 suggests undervaluation.

4. Defensive Industry Position
Food companies benefit from consistent consumer demand.

5. Potential Price Recovery as Conditions Improve
Even modest improvement could drive meaningful upside.


Investment Risks

Despite its strengths, investors should consider potential risks:

  • High debt levels (~$8.28 billion)
  • Slowing revenue growth
  • Inflation and commodity cost pressures
  • Changing consumer dietary preferences

These risks explain the stock’s depressed valuation but also contribute to its opportunity.


Conclusion: Attractive Income Play with Recovery Potential

Conagra Brands represents a classic high-yield, undervalued income stock. While recent operational challenges have pushed shares lower, the company continues generating strong cash flow and paying a highly attractive dividend.

For income-focused investors and those seeking undervalued defensive stocks, Conagra offers:

  • Strong income potential
  • Possible capital appreciation
  • Defensive consumer staples exposure

If operational performance stabilizes and investor sentiment improves, Conagra Brands could deliver both income and moderate capital gains over the coming year.


Disclosure

The author currently holds a position in Conagra Brands (CAG). This article is for informational purposes only and should not be considered financial advice. Investors should conduct their own research or consult a financial advisor before making investment decisions.


References

StockAnalysis.com. (2026). Conagra Brands stock statistics and valuation. Retrieved from https://stockanalysis.com/stocks/cag/statistics/

StockAnalysis.com. (2026). Conagra Brands dividend information. Retrieved from https://stockanalysis.com/stocks/cag/dividend/

StockAnalysis.com. (2026). Conagra Brands stock overview. Retrieved from https://stockanalysis.com/stocks/cag/

CompaniesMarketCap.com. (2026). Conagra Brands dividend yield and market cap. Retrieved from https://companiesmarketcap.com/conagra-brands/dividend-yield/

CompaniesMarketCap.com. (2026). Conagra Brands dividend history. Retrieved from https://companiesmarketcap.com/conagra-brands/dividends/

MarketBeat.com. (2026). Conagra Brands dividend payout ratio and yield analysis. Retrieved from https://www.marketbeat.com

Reuters. (2025). Conagra maintains forecasts amid subdued demand. Retrieved from https://www.reuters.com

Barron’s. (2025). Conagra downgraded due to rising meat prices. Retrieved from https://www.barrons.com

The Importance of Power Skills for Career Success

It is tempting to believe that success is driven primarily by technical skills or access to the right tools. In my experience, however, the true differentiators remain far more human: the ability to speak clearly, the ability to write effectively, and the quality of one’s ideas.

These skills are not soft skills they are power skills. They determine who gets heard, who gets trusted, and who ultimately gets ahead.

The Power of Speaking Well

Your ability to speak is your ability to influence. Whether you are pitching an idea, leading a team, negotiating a deal, or networking, spoken communication shapes how others perceive your competence and confidence.

Strong speakers do more than relay information they create clarity. They simplify complexity, inspire action, and build trust in real time. In contrast, unclear or hesitant speech often undermines even the strongest ideas. People rarely follow what they do not understand.

In leadership, speaking well is not about volume or charisma alone; it is about structure, intent, and the discipline to communicate with purpose.

Writing: The Skill That Scales Your Impact

If speaking builds influence in the moment, writing builds influence over time. Clear writing forces clear thinking. It sharpens ideas, exposes weak logic, and turns vague thoughts into actionable insights.

Professionals who write well are more likely to be trusted, promoted, and remembered. Emails, reports, proposals, social posts, and articles become extensions of your reputation. Poor writing creates friction. Strong writing creates momentum.

In many careers, writing is the invisible skill behind leadership. Those who can document decisions, articulate vision, and explain strategy gain leverage long after the conversation ends.

The Quality of Your Ideas Is the Foundation

Communication alone is not enough. It must be paired with ideas that matter.

High-quality ideas are original, practical, and grounded in reality. They solve real problems or offer new perspectives on familiar challenges. The most successful individuals are not necessarily the smartest in the room but they are often the clearest thinkers.

Ideas improve when you read widely, think critically, ask better questions, and challenge your own assumptions. Great ideas are rarely accidental; they are the product of intentional mental effort.

Additional Factors That Multiply Success

Beyond speaking, writing, and ideas, success is accelerated by a few reinforcing traits:

  • Consistency: Showing up and delivering reliably builds credibility.
  • Emotional intelligence: Understanding people strengthens communication and leadership.
  • Adaptability: The ability to learn and adjust keeps skills relevant.
  • Discipline: Talent matters, but execution compounds over time.

Together, these traits amplify your core communication abilities and help convert potential into results.


Keys to Success: A Practical Breakdown

Key to SuccessWhy It MattersImpact on Long-Term Success
Ability to Speak ClearlyBuilds trust, influence, and leadership presenceDetermines who is heard and followed
Ability to Write EffectivelyClarifies thinking and scales communicationEnhances credibility and decision-making
Quality of IdeasDrives innovation and problem-solvingSeparates contributors from leaders
Critical ThinkingStrengthens judgment and logicImproves decision quality
Emotional IntelligenceImproves relationships and persuasionIncreases leadership effectiveness
ConsistencyBuilds reliability and reputationCompounds trust over time
AdaptabilityKeeps skills relevant in changing environmentsSustains long-term career growth
DisciplineTurns intent into executionConverts goals into outcomes

Final Thought

Success is not reserved for those with the loudest voices or the most advanced tools. It belongs to those who can think clearly, express ideas with precision, and communicate in ways that move people to action. Master your words, refine your ideas, and you will expand your influence no matter the field.

Redesigning Work to Combat Burnout

For years, burnout has been framed as a personal shortcoming: a lack of resilience, poor time management, or insufficient grit. Employees are encouraged to meditate more, exercise after work, or attend yet another wellness webinar. While these tools have value, they miss a critical truth burnout is rarely an individual failure. It is, far more often, a workplace design issue.

Modern organizations frequently reward busyness over effectiveness. Long hours are worn as badges of honor. Full calendars are equated with importance. Immediate responsiveness is treated as commitment. In this environment, exhaustion is not an anomaly it is the predictable outcome of how work is structured, measured, and led.

The Architecture of Burnout

Burnout thrives in systems with unclear priorities, constant interruptions, and unrealistic expectations. When employees are asked to do more with less, less time, less support, less autonomy and stress compounds. Add in ambiguous goals, frequent “urgent” requests, and a culture that discourages disconnecting, and burnout becomes inevitable.

Importantly, these conditions are not created by individual employees. They are embedded in workflows, performance metrics, and leadership norms. When success is defined by speed rather than sustainability, people will push themselves until they break—or leave.

Why Personal Fixes Fall Short

Placing the burden of burnout prevention on individuals can unintentionally worsen the problem. It suggests that if someone is struggling, they simply are not trying hard enough to cope. This approach ignores systemic contributors such as understaffing, poor role clarity, and chronic overwork.

Wellness initiatives cannot compensate for broken systems. No amount of mindfulness can offset a workload that consistently exceeds capacity. Without structural change, individual-level solutions amount to temporary relief at best.

Slowing Down as a Leadership Advantage

In a culture obsessed with hustle, slowing down may seem counterintuitive. Yet, it is increasingly one of the most effective leadership strategies available.

Leaders who intentionally slow the pace create space for clarity, focus, and better decision-making. They prioritize what truly matters, reduce unnecessary work, and model healthy boundaries. This does not mean lowering standards; it means designing work in a way that people can sustain high performance over time.

Organizations that embrace this approach often see measurable benefits: improved engagement, lower turnover, fewer errors, and stronger long-term results. Thoughtful pacing enables teams to think strategically rather than constantly reacting.

Redesigning Work for Sustainability

Addressing burnout requires leaders to look beyond individual behavior and examine how work is designed. Key questions include:

  • Are priorities clear and stable?
  • Are workloads realistic given available resources?
  • Do employees have autonomy over how they do their work?
  • Is rest respected, or quietly penalized?

When leaders take responsibility for these factors, burnout shifts from being a personal problem to an organizational challenge—one that can be solved through better design, not more grit.

A Cultural Reframe

Burnout is not a sign that people are weak. It is a signal that the system is strained. In a world that rewards busyness, leaders who choose to slow down are not falling behind they are building smarter, healthier, and more resilient organizations.

The future of work will not belong to those who move the fastest, but to those who design environments where people can perform at their best without burning out along the way.

Five9, Inc. (NASDAQ: FIVN): Evaluating a Cloud Communications Leader Heading Into 2026

Five9, Inc. is a leading provider of cloud-based contact center software, operating within the rapidly expanding Contact Center as a Service (CCaaS) market. As enterprises continue to modernize customer engagement through artificial intelligence and cloud infrastructure, Five9’s platform positions the company at the intersection of digital transformation and customer experience optimization (Five9, Inc., 2025).


Company Overview

Founded in 2001, Five9 delivers cloud-native contact center solutions that integrate voice, digital channels, workforce optimization, and AI-powered automation. The company’s offerings are designed to help enterprises improve customer satisfaction while reducing operational complexity and costs. Five9 primarily serves mid-market and large enterprise customers, with a business model heavily weighted toward recurring subscription revenue (Trefis, 2025).

The CCaaS market continues to benefit from long-term secular tailwinds, including remote work adoption, omnichannel customer engagement, and enterprise investment in AI-driven customer support solutions (Seeking Alpha, 2025).


Financial Performance and Health Snapshot

Revenue and Growth

Five9 reported record full-year revenue exceeding $1 billion, reflecting consistent double-digit growth driven by enterprise adoption and expanding AI-enabled services (Five9, Inc., 2024). Recent quarterly results show revenue growth in the low double-digit range, signaling moderation from prior hypergrowth years but still outperforming many legacy contact center competitors (Investing.com, 2025a).

Profitability and Margins

Operational efficiency has improved as the company scales. Adjusted EBITDA margins have expanded into the low-to-mid 20% range, supported by higher software margins and disciplined cost management (Seeking Alpha, 2025). While GAAP profitability remains pressured by stock-based compensation, non-GAAP earnings and free cash flow generation have shown steady improvement (NASDAQ, 2025).

Balance Sheet Strength

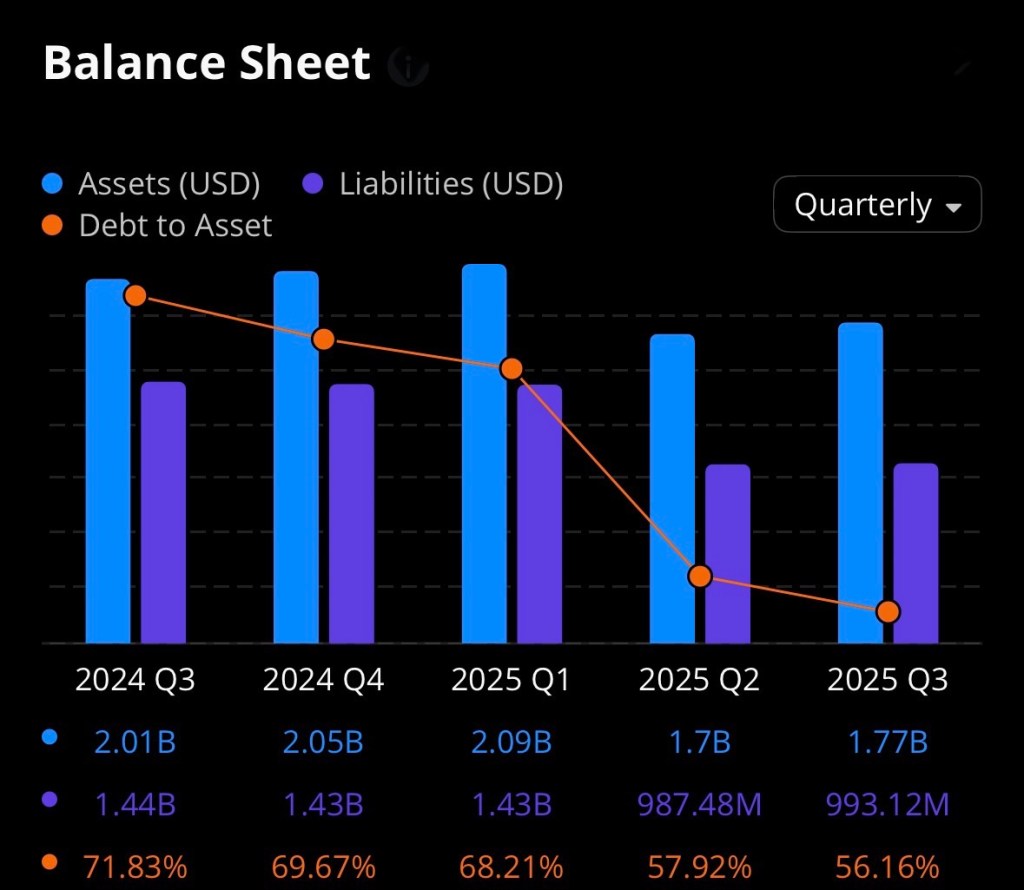
Five9 maintains a solid liquidity position, supported by cash reserves and manageable debt levels. The company has also authorized share repurchase activity, signaling management confidence in long-term value creation despite near-term stock volatility (Investing.com, 2025b).


Stock Price and Market Performance

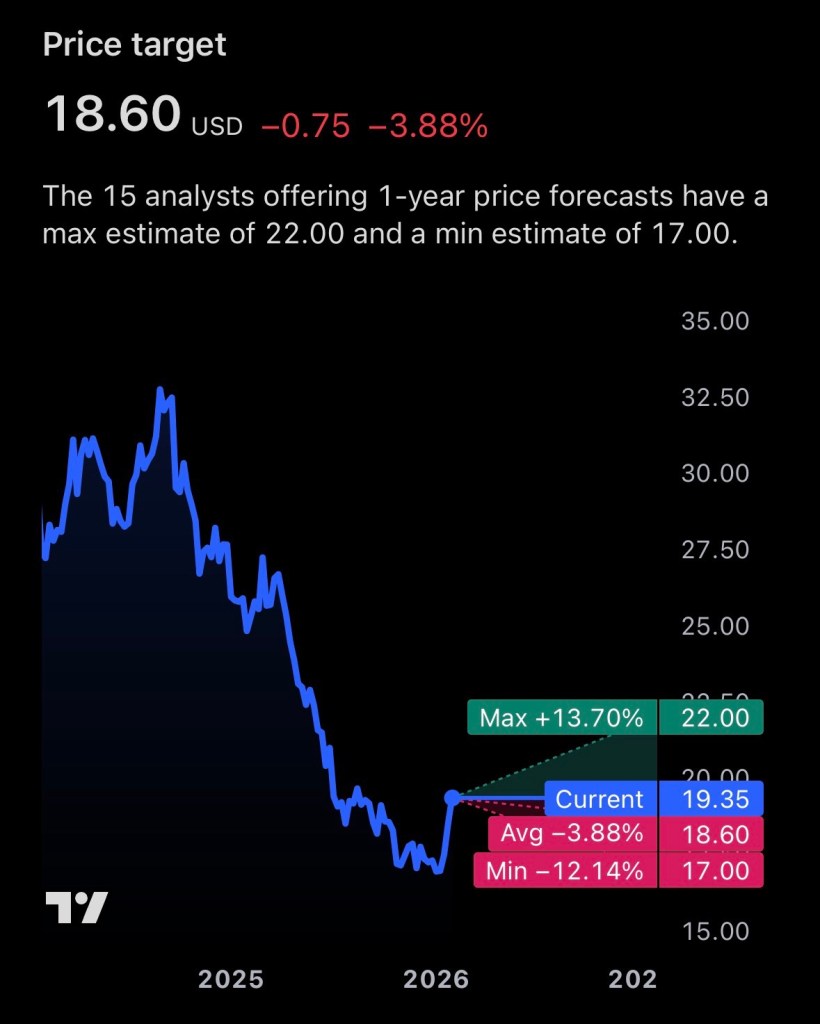
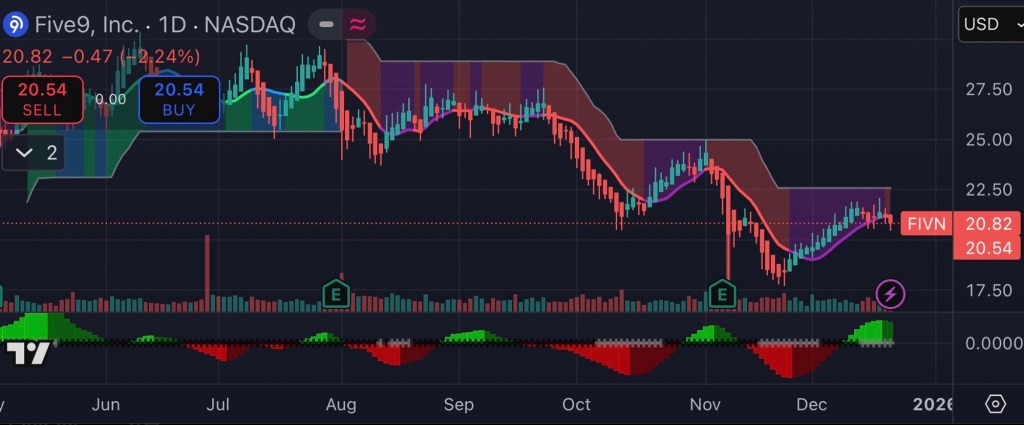
As of late 2025, Five9 shares have experienced significant price compression, trading well below prior cycle highs. The stock recently touched a 52-week low, reflecting broader SaaS sector multiple contraction, investor caution around growth deceleration, and macroeconomic uncertainty (Investing.com, 2025c).

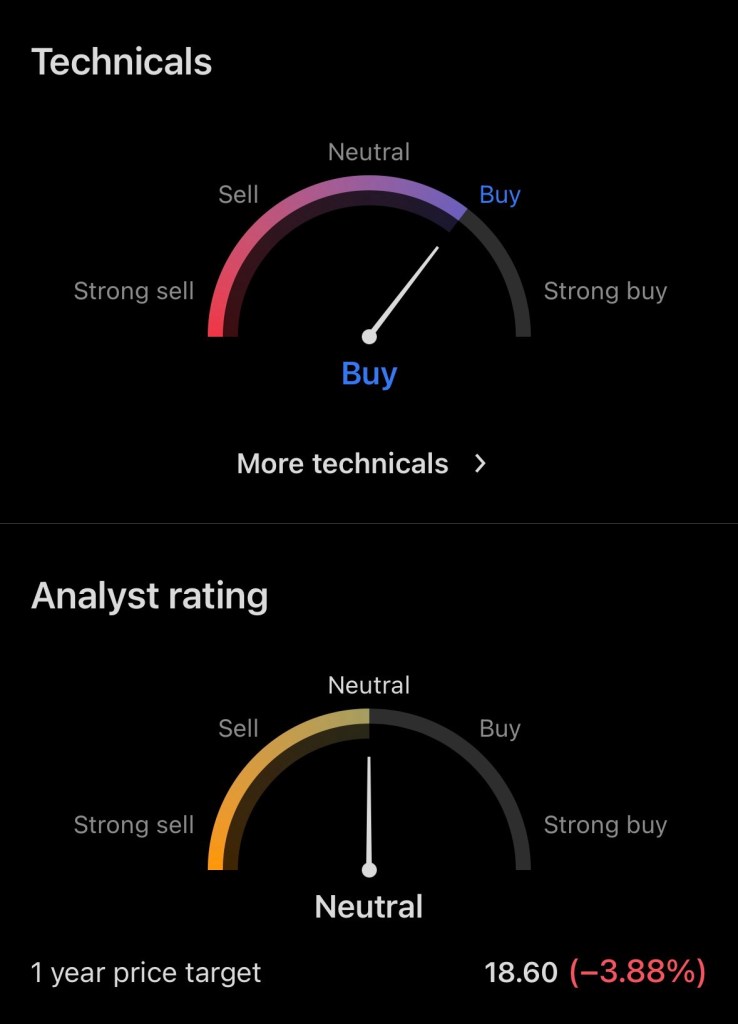
Despite the decline, valuation metrics such as price-to-sales and enterprise-value-to-revenue ratios now sit below historical averages for high-quality SaaS peers, suggesting the market may be discounting future growth more aggressively than current fundamentals justify (NASDAQ, 2025).


Why Five9 May Be an Attractive Investment Heading Into 2026

1. AI-Driven Product Expansion

Five9 continues to embed artificial intelligence across its platform, including intelligent virtual agents, real-time analytics, and automation tools. AI-related revenue has grown faster than the company’s core business, positioning Five9 to benefit from rising enterprise demand for scalable, automated customer engagement (Seeking Alpha, 2025).

2. Recurring Revenue Visibility

A substantial majority of Five9’s revenue is derived from subscriptions, providing predictable cash flows and improved earnings visibility. This recurring model is a key attribute investors seek in mature SaaS companies navigating economic cycles (Trefis, 2025).

3. Margin Expansion Potential

As growth stabilizes and operating leverage improves, Five9 has the potential to further expand margins, particularly if AI-driven products command premium pricing and reduce customer churn (NASDAQ, 2025).

4. Strategic Optionality

Ongoing consolidation within the cloud communications and enterprise software space creates potential upside through partnerships, acquisitions, or strategic interest from larger technology firms seeking to expand their customer experience portfolios (Investing.com, 2025b).


Risks and Considerations

While the long-term outlook remains constructive, investors should remain mindful of several risks. These include intensified competition from well-capitalized rivals, potential delays in enterprise spending, and the possibility that revenue growth continues to decelerate more rapidly than expected (Investing.com, 2025a). Additionally, broader market sentiment toward technology stocks could continue to influence valuation multiples independent of company performance.


Conclusion

Five9 enters 2026 as a financially stable, AI-focused SaaS company operating in a structurally growing market. Although near-term growth has moderated and share price volatility remains elevated, improving margins, recurring revenue strength, and expanding AI capabilities provide a foundation for potential long-term value creation. For investors willing to tolerate short-term uncertainty, Five9 represents a company where fundamentals and market valuation may diverge heading into the next phase of the cloud communications cycle (Five9, Inc., 2025; Seeking Alpha, 2025).

Disclosure:
I do not hold, directly or indirectly, any equity position in Five9, Inc. (NASDAQ: FIVN) at the time of writing. This article is provided for informational and educational purposes only and should not be construed as investment advice, a recommendation to buy or sell securities, or a solicitation of any investment strategy. Readers should conduct their own due diligence and consult a qualified financial professional before making any investment decisions.


References (APA Format)

Five9, Inc. (2024). Five9 reports record full-year revenue exceeding $1 billion. Five9 Investor Relations.
https://investors.five9.com

Five9, Inc. (2025). Quarterly earnings and financial results. Five9 Investor Relations.
https://investors.five9.com/financials

Investing.com. (2025). Five9 stock hits 52-week low amid market volatility.
https://www.investing.com

Investing.com. (2025). Cantor Fitzgerald lowers Five9 price target citing growth moderation.
https://www.investing.com

NASDAQ. (2025). Five9, Inc. (FIVN) stock quote, financials, and performance data.
https://www.nasdaq.com

Seeking Alpha. (2025). Five9: AI-driven contact center growth and margin expansion.
https://www.seekingalpha.com

Trefis. (2025). Five9 business model, revenue mix, and valuation analysis.
https://www.trefis.com

Celsius $CELH: A sip, a chart, and why traders/investors are watching

You try a new drink and “boom” the product tastes great. That’s exactly what happened when I tried a CELSIUS energy beverage and then went to check the stock. Celsius Holdings (ticker CELH) has been one of the market’s high-profile consumer names this year: rapid top-line growth, headline M&A and distribution moves, and a volatile but elevated share price. Here’s a concise news-style breakdown of what the company is doing, where the stock sits now, why some investors think it’s attractive, and what risks to keep in mind.


Where the stock sits right now

As of November 22, 2025, CELH is trading in the ~$39 range after a pullback from summer highs. Recent intraday and close prints in mid–late November show the stock around $38–$44 depending on the day and data feed. (Investing.com+1)

(See the chart below for an illustrative monthly price run from Oct 2022 → Nov 2025.)

The chart — price context

(Illustrative monthly closes Oct 2022 → Nov 2025; compiled show how the stock ran from low-$20s into the $50–$60 range in mid-2025, then pulled back into the high-$30s in November.) The chart below uses monthly close data gathered from public historical-price sources (illustrative).


Quick company snapshot

Celsius Holdings is a challenger in the energy and “fitness” drink space, known for zero-sugar, functional energy beverages marketed toward active consumers. Over the past 18 months the company has accelerated growth through product line extensions, international distribution deals, and material M&A — most notably the purchase of Alani Nu earlier in 2025 and the addition of Rockstar’s U.S. rights to its portfolio (with PepsiCo retaining international Rockstar ownership). The company says combined brands have been growing well above the U.S. energy category. (Celsius Holdings+1)

Revenue has moved from hundreds of millions to more than $1.3 billion in 2024 and showed continued expansion into 2025, reflecting distribution gains and the Alani Nu contribution. (Macrotrends)


Major recent catalysts (what moved the stock)

  • PepsiCo strategic expansion & stake: In August 2025 PepsiCo increased its position via convertible preferred shares and agreed to deepen distribution cooperation PepsiCo’s ownership rose to ~11% and PepsiCo will lead distribution for the combined U.S./Canada energy portfolio. That strategic tie (and a PepsiCo board nomination) materially de-risked parts of Celsius’s distribution story and boosted investor sentiment. (Reuters+1)
  • Acquisitions & brand consolidation: Celsius acquired Alani Nu (female-focused, strong social media presence) and obtained U.S. rights to Rockstar Energy building a “total energy portfolio.” Those moves give Celsius scale, broader consumer reach, and leverage in retailer negotiations. (Celsius Holdings+1)
  • International expansion & flavors: New distribution agreements (e.g., Suntory in the Netherlands) and new flavor launches support deeper retail penetration outside the U.S. and product innovation. (Celsius Holdings)

Investment thesis — why some investors like CELH now

  1. Distribution muscle via PepsiCo having PepsiCo handle distribution in major channels materially increases shelf placement potential and reduces execution risk versus trying to scale purely on indie distribution. The partnership also sends a validation signal from a major CPG player. (Reuters+1)
  2. Brand roll-up strategy combining CELSIUS, Alani Nu and the U.S. Rockstar rights creates cross-sell and SKU strategies, economies of scale on procurement/marketing, and more negotiating power with retailers and foodservice. If integration succeeds, revenue and margin expansion are plausible. (Celsius Holdings)
  3. Strong top-line momentum year-over-year revenue growth has been large over prior years as the product reached mass retail and new channels; that revenue base makes future earnings expansion possible if margins recover. (Macrotrends)
  4. Growth + trading volatility = alpha opportunity for traders, CELH’s pronounced swings around news (earnings, deals, distribution announcements) create short-term setups momentum squeezes, event trades around earnings, and pullback buys after headline consolidation.

Where it might be headed simple scenario sketch (not investment advice)

Below are illustrative, hypothetical scenarios to frame risk/reward. They are not price targets from an analyst they are scenario examples based on company catalysts and typical valuation ranges for high-growth consumer names.

  • Bull case (successful integration & continued distribution lift): If combined brands scale and margins improve, revenue multiples could re-rate and push CELH back toward its summer highs in the $55–$75 range over 6–12 months (driven by multiple expansion + execution). Key drivers: faster retail rollouts via PepsiCo, international growth, margin leverage. (Celsius Holdings+1)
  • Base case (steady growth, some margin pressure): Continued revenue growth but slower margin recovery; stock trades in a midrange band around $35–$55 as investors balance growth with execution risk. (Macrotrends)
  • Bear case (integration/competition trouble, macro slowdown): Execution issues, weaker retail sell-through, or broader consumer pullback could push the stock below $25–$30 if growth disappoints or if the market de-rates high-growth consumer names. (FullRatio)

Sources for price and history: market feeds and historical pages (Investing.com, Yahoo Finance and similar). I(nvesting.com+1)

Risks — what could go wrong

  • Integration risk: acquisitions (Alani Nu, Rockstar U.S. rights) need careful integration; cultural or distribution missteps can sap margin and distract management. (Celsius Holdings)
  • Valuation & volatility: CELH has been a volatile, headline-driven name sharp moves up and down occur on news. Short-term traders may profit, long-term investors must stomach drawdowns. (Investing.com)
  • Competition & category dynamics: energy and functional beverages are crowded (PepsiCo, Monster, Red Bull, private labels); sustained share gains aren’t guaranteed.
  • Profitability swings: EPS over recent trailing periods has been uneven; margins can be pressured by promotional activity and integration costs. (FullRatio)

Bottom line

Celsius is no longer a small niche brand by revenue and deal activity it has scaled into a major, fast-moving name in energy drinks. The PepsiCo strategic tie and brand acquisitions give a clear pathway for distribution and scale, which is why many investors view CELH as an interesting growth play. That said, the stock’s rapid move higher earlier in 2025 and recent pullbacks underline both the upside and the volatility. For traders, event-driven setups and momentum plays can work; for investors, the key questions are whether integration lifts margins and whether PepsiCo’s distribution materially accelerates sustainable growth.

If you liked the drink and are thinking about buying shares, consider: (1) define whether you’re trading or investing, (2) size the position relative to the volatility, and (3) track integration and distribution KPIs (retail placements, foodservice uptake, international rollouts) as the real operational signs that the thesis is working. Official company releases, earnings calls and retail-level data will be the best evidence to watch. (Celsius Holdings+1)


Disclosure: I’m not a licensed financial advisor. This is market commentary and not personalized investment advice. Do your own research (DYOR) check the latest filings and the company’s next earnings release and consider speaking with a licensed professional before trading or investing.


References

Celsius Holdings. (2025). Celsius Holdings reports third quarter 2025 results [Press release]. https://www.celsiusholdingsinc.com/

Investing.com. (2025). Celsius Holdings Inc. (CELH) historical data. Retrieved November 2025, from https://www.investing.com/
(Note: Replace with direct historical-data link if desired.)

Macrotrends. (2025). Celsius Holdings revenue 2015–2025. Retrieved November 2025, from https://www.macrotrends.net/

Reuters. (2025, August 29). PepsiCo boosts stake in energy drink maker Celsius. https://www.reuters.com/

Reuters. (2025). Celsius to buy Alani Nu and combine U.S. rights to Rockstar Energy. https://www.reuters.com/

Yahoo Finance. (2025). Celsius Holdings, Inc. (CELH) stock price & historical data. Retrieved November 2025, from https://finance.yahoo.com/

Why We Always Find Ourselves Waiting: The Hidden Cost of Life’s Slowdowns

Waiting might be one of the few universal human experiences that transcends age, background, income, geography, and even personality. Whether we’re stuck in a doctor’s office long past our appointment time, refreshing a stock chart hoping for a green candle, or watching an insurance claim crawl its way through the system, waiting is a constant companion. And while it can be frustrating, it also reveals a lot about how modern life actually works.

The Doctor Will Be With You… Eventually

Anyone who has ever dealt with healthcare knows that time moves differently in a medical office. You check in early, only to wait 20 minutes to be called, 10 more in the exam room, and maybe another week to get your test results.

Doctors aren’t slow because they want to be; they’re slow because they must be. Every patient brings unpredictability. A quick check-up can instantly turn into a crisis, care requires paperwork, and healthcare systems are overloaded. But as patients, it doesn’t feel like logistics it feels like we’re just waiting… and waiting.

Many people walk out feeling like they spent more time sitting than being seen. And that’s because they have.

Waiting on the Markets: The Slow Burn of Investing

If there’s any arena that tests patience like a doctor’s office, it’s the stock market. You can research the perfect company, run the numbers, time your entry… and still spend weeks or months waiting for the payoff.

Stocks rarely move on our schedule. Bull markets take time to build, bear markets linger longer than anyone likes, and sideways trading can feel like a cosmic joke designed to test your discipline. You watch your screen, refresh your app, maybe check the news again just in case something changed in the last 45 seconds.

But over the long run, waiting is the strategy. The real returns historically come not from timing the market, but time in the market. Yet even knowing that, we still find ourselves impatient, hoping our future arrives faster.

Insurance: The Art of Hurry Up and Wait

Insurance is another world where waiting feels baked into the design. You file a claim and expect progress. Instead, you’re asked for more documentation, another photo, a follow-up call, a review, an inspection… and then another review.

Insurance companies aren’t trying to delay—they’re trying to verify. Risk assessment requires accuracy, and accuracy takes time. But when it’s your car, your home, your medical bill, or your livelihood on the line, the process can feel like a slow-motion movie you can’t fast-forward.

Ironically, we pay for insurance to create peace of mind, but the waiting period is often when we feel the least at peace.

Everyday Waiting: The Silent Theme of Modern Life

Outside those big moments, waiting quietly follows us everywhere:

  • Waiting for a package that says “Out for delivery” for eight hours
  • Waiting for traffic to move
  • Waiting for approval, promotion, or a simple call-back
  • Waiting for the next phase of life—marriage, career change, retirement
  • Waiting for things to “finally calm down” (which never seems to happen)

Humans weren’t built to sit in uncertainty. Psychologically, waiting triggers the same stress response as danger. Our brains want clarity and control two things waiting rarely provides.

The Hidden Reason We Wait: Progress Takes Time

Whether it’s the doctor, the market, insurance, or our daily errands, waiting is ultimately a byproduct of systems in motion. Progress doesn’t happen in a straight line or on a schedule we set.

In many ways, waiting is proof that something is happening:

  • The doctor is giving someone else the attention you’ll soon get
  • The stock market is adjusting, recalibrating, and preparing for the next move
  • The insurance company is verifying everything you need to protect your future
  • Life is unfolding in real time not rushed, not delayed, simply moving at its own pace

We wait because the world is constantly working behind the scenes, even when we can’t see it.

Turning Waiting Into Something Useful

While we can’t eliminate waiting, we can change what it means to us. Waiting offers a rare chance to pause a moment to reflect, reset, or simply breathe. It forces us to surrender a little control and trust the process, uncomfortable as that may be.

Because when the moment finally comes whether it’s the doctor walking in, your stock finally breaking out, or the insurance claim resolving waiting reminds us that good things often take time.

And maybe, just maybe, learning to wait is one of the most valuable skills we’ll ever develop.