VICI Properties: A 6.8% Dividend, Real-Estate Cash Machine & a Potential Swing-Trade Opportunity

VICI Properties Is More Than a Casino REIT

When investors hear VICI Properties Inc. (NYSE: VICI), the first thing that usually comes to mind is Las Vegas and for good reason. VICI owns the real estate behind some of the most recognizable gaming and entertainment properties in the country, including Caesars Palace Las Vegas, MGM Grand and the Venetian Resort Las Vegas.

But describing VICI as simply a “casino REIT” undersells the company.

VICI is an experiential real-estate investment trust that owns 103 properties across the United States and Canada, including 63 gaming properties and 40 other experiential properties. Its portfolio encompasses approximately 130 million square feet, 66,000 hotel rooms and more than 700 restaurants, bars, nightclubs and sportsbooks.

The company’s business model is particularly attractive from a cash-flow perspective: VICI generally owns the real estate while experienced operators run the businesses. Those operators pay VICI rent through long-term triple-net leases, meaning the tenants generally assume responsibility for property-level expenses such as taxes, insurance and maintenance.

That structure gives VICI something investors should appreciate: relatively predictable recurring rental revenue without having to operate the casinos itself.

And at today’s share price, that cash-flow model is becoming increasingly interesting.

The Regent casino hotel complex beside the sea at dusk
The Regent casino resort glows beside landscaped lagoons and the sea at dusk.

The Stock Is Trading at a Significant Discount to Its 52-Week High

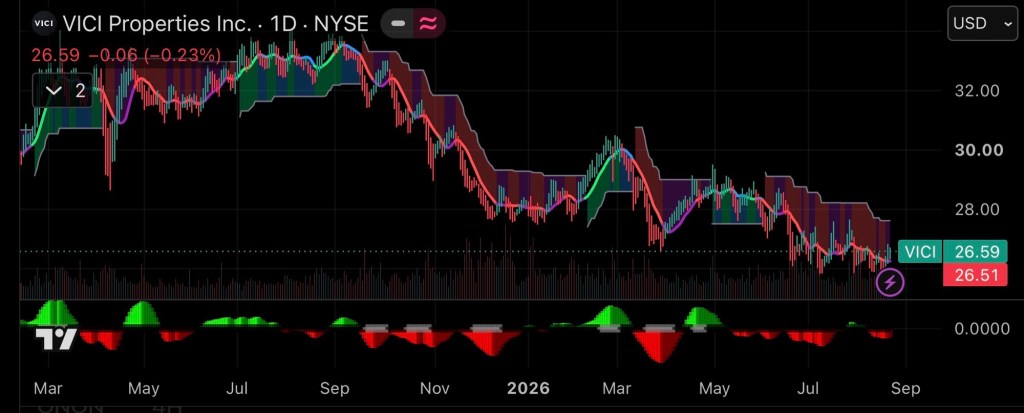
VICI closed around $26.51 on August 21, 2026, leaving the stock roughly 22% below its 52-week high of $33.92.

That decline is important because VICI’s underlying business has not collapsed.

Quite the opposite.

In its most recent quarter, VICI reported:

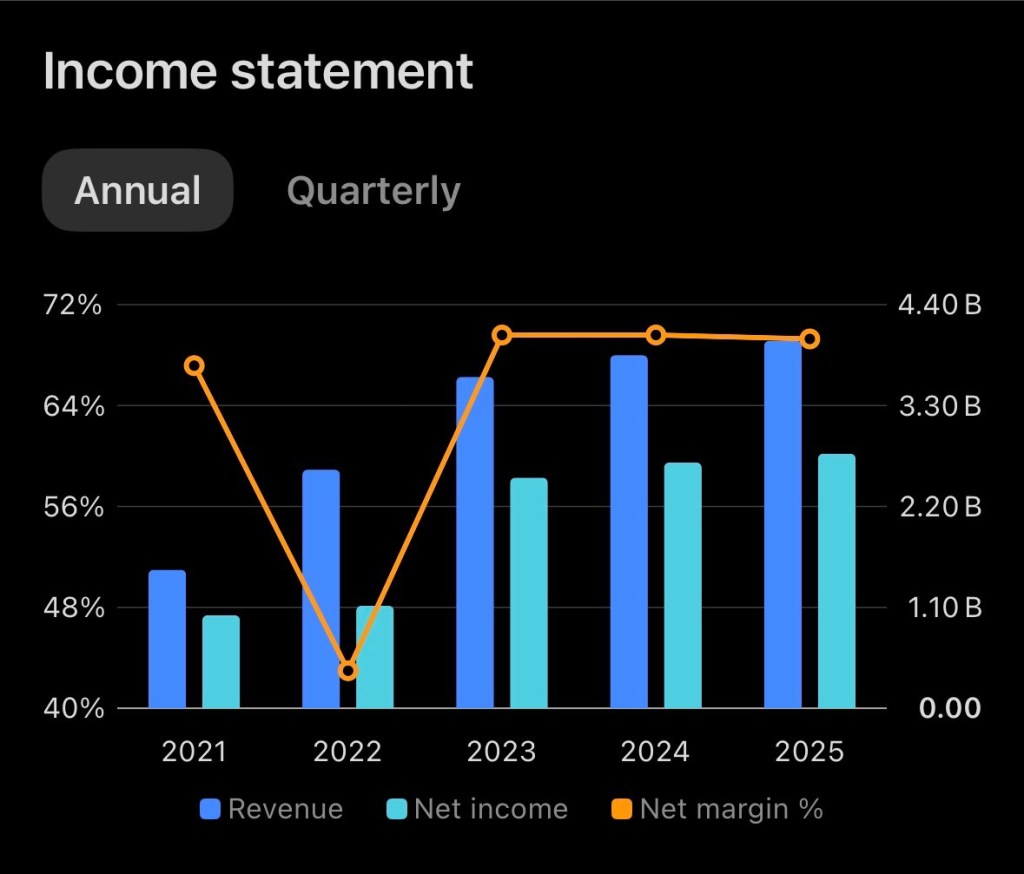
  • Revenue: approximately $1.1 billion, up 5.7% year over year
  • AFFO: $679.6 million, up 7.8%
  • AFFO per share: $0.62, up 4.6%
  • Full-year 2026 AFFO guidance: $2.45–$2.47 per share

AFFO- adjusted funds from operations is arguably the more important metric for a REIT investor because it provides a better picture of the recurring cash-generating capacity of the business than conventional GAAP earnings.

That distinction matters with VICI.

The company’s second-quarter GAAP net income fell sharply year over year, but management attributed much of the decline to a change in its non-cash credit-loss allowance. AFFO, meanwhile, increased.

In other words, the headline EPS number looks considerably worse than the underlying recurring cash-flow picture.
The Dividend Is the Big Attraction

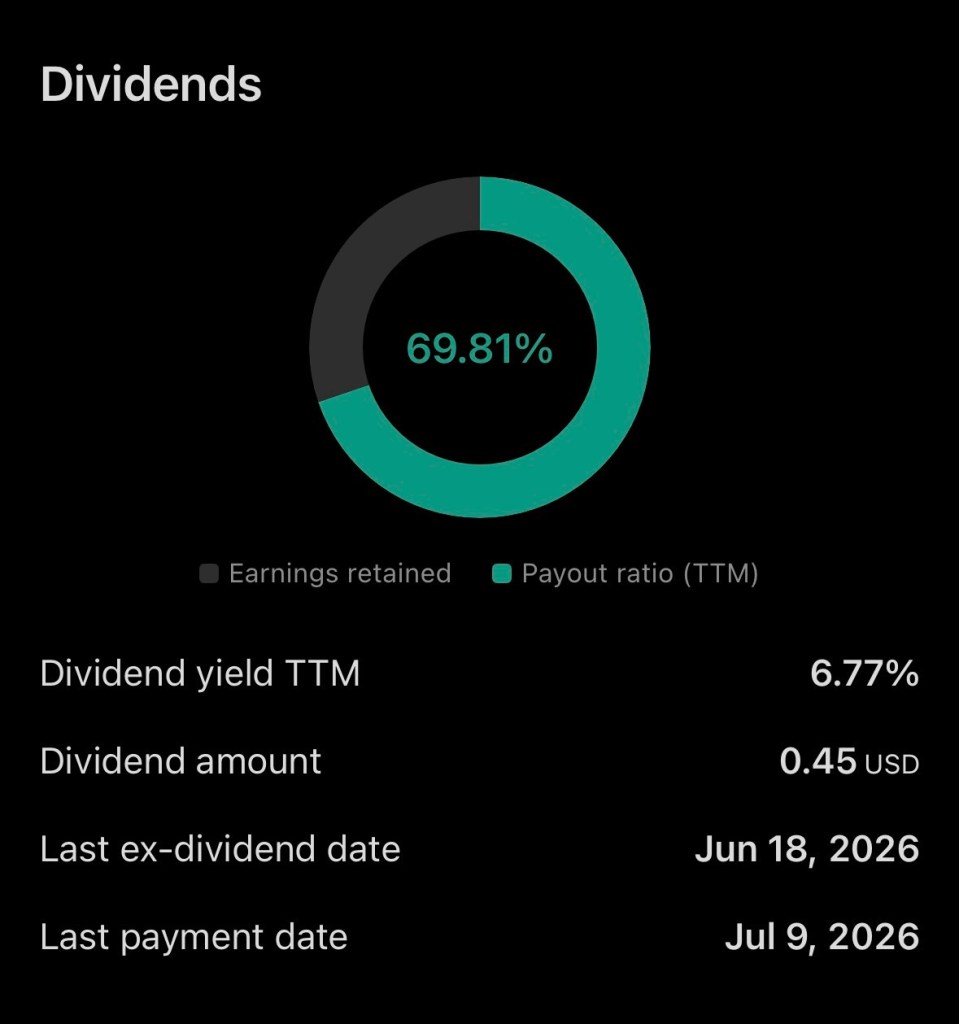
VICI currently pays a $0.45 quarterly dividend, or $1.80 annually if maintained at the current rate. The company has maintained the $0.45 quarterly payout through 2026.

At approximately $26.51 per share, that equates to a forward dividend yield of roughly:

$1.80 ÷ $26.51 = 6.79%

That’s a substantial yield for an S&P 500 company.

More importantly, VICI’s dividend has grown considerably since the company was formed. VICI’s annual dividend increased from $1.00 in 2018 to $1.77 in 2025, while the 2026 quarterly rate stands at $0.45.

Dividend Growth

YearAnnual Dividend
2018$1.00
2019$1.17
2020$1.26
2021$1.38
2022$1.50
2023$1.61
2024$1.70
2025$1.77
2026 annualized$1.80

Source: VICI Properties investor relations.

The growth rate has moderated as VICI has become larger, but the direction remains favorable.

Is the Dividend Covered?

This is where VICI gets particularly interesting.

Management’s 2026 AFFO guidance is $2.45–$2.47 per share. At a $1.80 annual dividend, the implied AFFO payout ratio is approximately 73%.

Using the midpoint of guidance:

$1.80 ÷ $2.46 = 73.2%

That leaves approximately 27% of AFFO per share above the current dividend.

For a REIT, that is a much more meaningful coverage measure than comparing the dividend with GAAP EPS.

It doesn’t mean the dividend is risk-free. VICI carries substantial debt, and REITs are particularly sensitive to interest rates and credit-market conditions. But the current payout appears reasonably supported by recurring AFFO.
VICI’s Growth Story Is Expanding Beyond Traditional Gaming

One of the more interesting aspects of VICI’s strategy is that management is trying to reduce the company’s dependence on traditional casino real estate.

During the second quarter, VICI added several important relationships.

The company welcomed Clairvest as its 14th tenant, Golden Entertainment as its 15th, and Club Med as its 16th tenant.

The Golden Entertainment transaction is particularly notable. VICI’s new Golden Entertainment Master Lease carries approximately $87 million in initial annual rent, a 30-year initial term and 2% annual rent escalators beginning in lease year three.

VICI also acquired the Carambola Beach Resort in St. Croix and plans to fund approximately $55.2 million of redevelopment through a build-to-suit arrangement with Club Med. The targeted reopening is in the fourth quarter of 2027.

That’s an important strategic development.

VICI isn’t abandoning gaming. Gaming remains its core competency.

But the company is increasingly attempting to become the landlord behind experiential destinations, including hospitality, wellness, golf and entertainment.

That potentially gives VICI a larger addressable market over time.

The Balance Sheet Is the Part Investors Should Watch

The biggest counterargument to the bullish VICI thesis is leverage.

As of June 30, 2026, VICI had approximately $17.2 billion of total debt and approximately $2.5 billion of liquidity, including cash and availability under its revolving credit facility.

That is not insignificant.

A REIT with substantial debt can perform very well when interest rates cooperate, but higher rates increase the cost of refinancing and can reduce the relative attractiveness of REIT yields compared with bonds and other fixed-income investments.

The good news is that VICI has continued to demonstrate access to capital and has been using interest-rate swaps to manage some future interest-rate exposure. As of June 30, the company had entered into $600 million of forward-starting interest-rate swaps.

The bad news is simple:

VICI doesn’t need a business crisis to underperform. Higher-for-longer interest rates alone can pressure the valuation.

That is one reason the stock can offer a nearly 7% yield while still trading at a discount to its previous highs.
What About a Swing Trade?

This is where VICI gets especially interesting.

VICI isn’t typically thought of as a swing-trading stock. It is a relatively mature REIT designed more for income and total return.

But that doesn’t mean it can’t be traded.

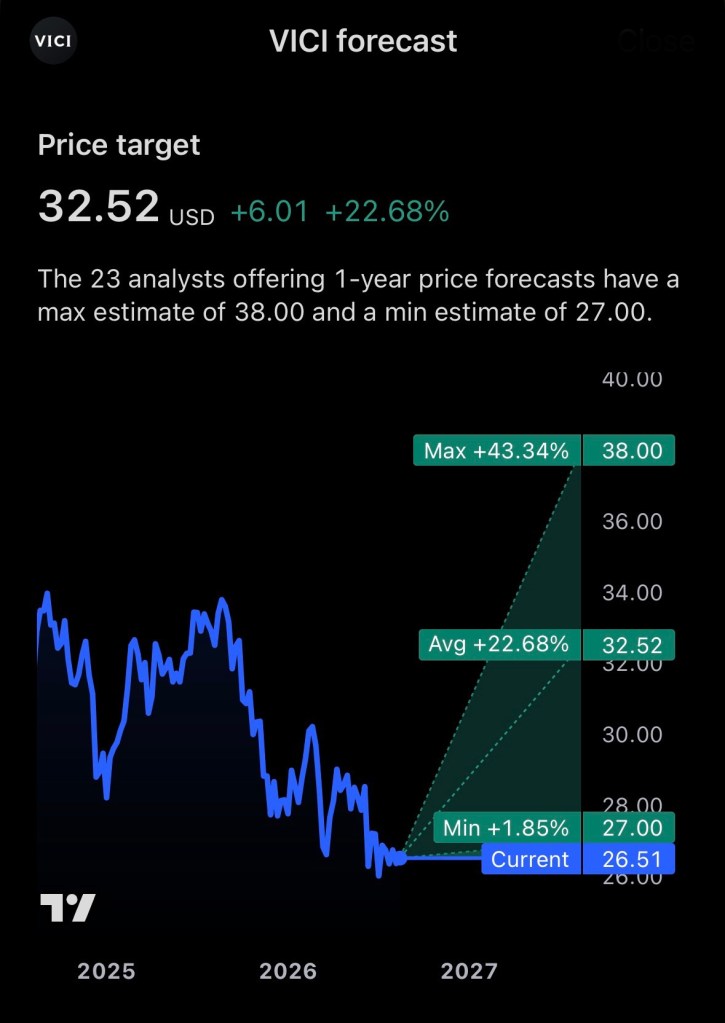
At approximately $26.51, the stock is sitting substantially below its prior $33.92 high.

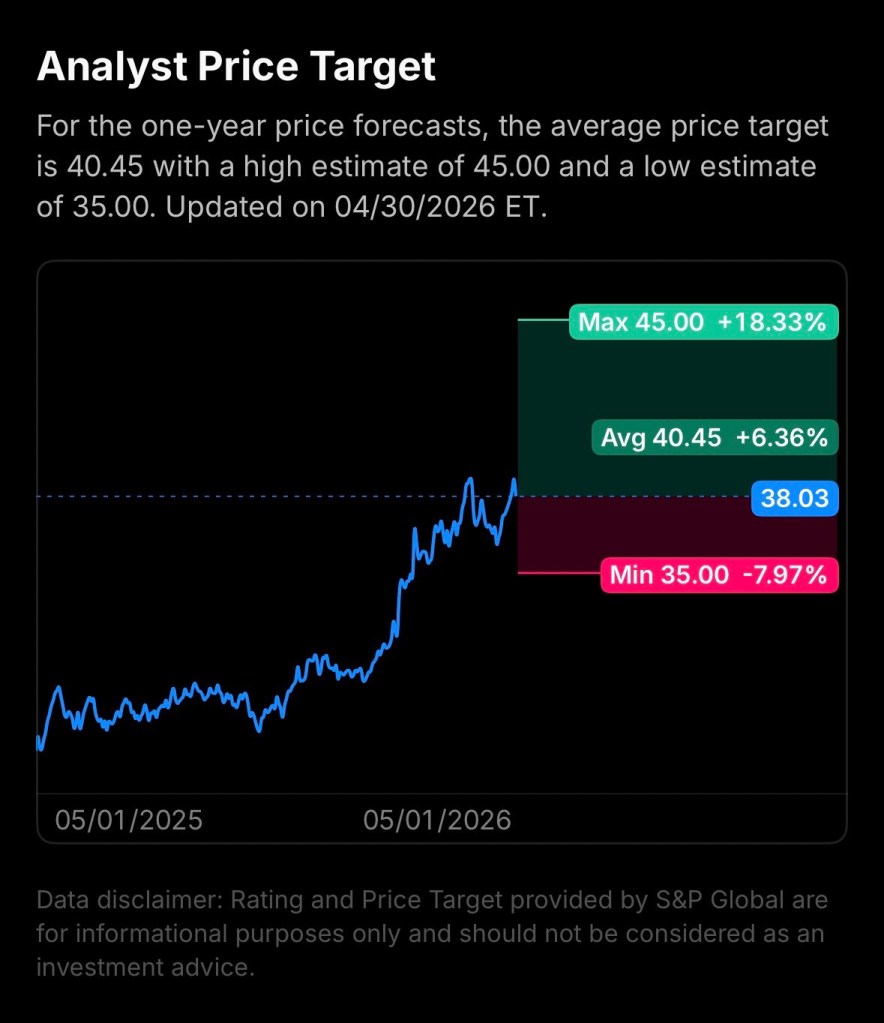
Wall Street’s valuation suggests the market may have become too pessimistic. Current analyst estimates vary, but several consensus sources place the average 12-month target around $31–$33, with some targets as high as $38.

That creates an interesting setup.

A Potential Swing-Trade Framework

Entry zone: approximately $25.75–$26.50

Initial target: approximately $28.50–$30.00

Secondary target: approximately $31–$32.50

Bull-case target: approximately $33–$34

Risk-management level: roughly $24.50–$25.00, depending on the trader’s risk tolerance and confirmation of a breakdown.

These aren’t guaranteed support and resistance levels; they’re a framework based on the stock’s recent trading range, prior price behavior and current valuation.

The key technical question is whether VICI can establish a sustained move above the $27–$28 area.

If it can, the next move toward $30 becomes considerably more interesting.

If the stock instead loses the mid-$25 area on heavy volume, the swing-trade thesis weakens and investors should be prepared for another leg lower.
The Dividend Creates an Interesting Trading Dynamic

There’s another reason VICI is different from many swing trades.

A trader buying VICI isn’t simply betting on price appreciation.

At the current annualized dividend, an investor receives approximately 6.8% annualized income while waiting for the market to recognize the potential valuation opportunity.

For example, a hypothetical $10,000 investment at $26.51 would purchase approximately 377 shares.

At $1.80 per share annually, those shares would generate approximately:

$679 per year in dividends

before taxes, assuming the dividend remains unchanged.

If VICI subsequently rose from $26.51 to $30:

  • Capital gain: approximately $1,316
  • Annual dividend income: approximately $679
  • Potential combined one-year return: approximately $1,995, or roughly 20%

That’s not a forecast. It’s simply an illustration of why a high-yield REIT can offer an attractive total-return setup when bought at a depressed valuation.

The Risks Should Not Be Ignored

The bullish case is compelling, but VICI isn’t a risk-free 7% yield.

1. Interest-rate risk

REIT valuations can suffer when Treasury yields rise because investors demand a higher yield from real estate securities.

2. Leverage

Approximately $17.2 billion of debt means refinancing costs and credit-market conditions matter.

3. Tenant concentration

Although VICI is diversifying its tenant base, gaming remains central to the portfolio. The financial health of major operators remains important to VICI’s rent collection.

4. Gaming-cycle risk

Casino and entertainment spending is discretionary. A recession or deterioration in consumer spending could negatively affect tenants.

5. Regulatory risk

Gaming is heavily regulated. VICI’s tenants must maintain the necessary licenses and regulatory approvals to operate their properties.

6. Dividend-growth moderation

The dividend is attractive, but investors shouldn’t assume the double-digit dividend-growth rates VICI achieved earlier in its history will continue indefinitely.

VICI itself highlights interest rates, tenant credit risk, gaming-industry conditions, regulation, leverage and economic conditions among the factors that could materially affect future results.

My Take: VICI Looks More Interesting at $26.50 Than It Did at $34

At approximately $26.51, VICI presents an unusual combination:

A high-quality experiential real estate portfolio + long-term leases + growing AFFO + a nearly 7% dividend yield + a stock price more than 20% below its 52-week high.

The market is clearly demanding a risk premium.

And investors should understand why.

The company has significant debt, remains exposed to interest rates and still derives substantial economics from the gaming industry.

But the latest operating numbers don’t suggest a deteriorating business.

Second-quarter AFFO per share increased 4.6%, management raised the low end of its 2026 AFFO guidance, and the company continues to expand its tenant base and experiential real-estate footprint.

At $26.51, VICI trades at roughly 10.8 times the midpoint of management’s 2026 AFFO guidance.

That’s a valuation I find considerably more compelling than the stock’s previous $33–$34 range.

Bottom Line

For income investors: VICI’s approximately 6.8% yield and roughly 73% AFFO payout ratio make the stock worth serious consideration for a diversified income portfolio.

For value investors: The stock’s discount from its 52-week high combined with growing AFFO creates an attractive risk/reward profile if interest-rate pressures ease.

For swing traders: The $25.75–$26.50 area offers an intriguing entry zone, with $28.50–$30 representing a reasonable first profit-taking region and $31–$33 providing a larger upside target if momentum improves.

My overall view: VICI is more attractive as a buy-and-hold income/total-return position than as a pure short-term trade—but the current valuation creates a legitimate swing-trade opportunity as well.

The most important catalyst to watch isn’t simply the next dividend.

It’s whether AFFO continues growing while interest-rate pressure on REIT valuations begins to fade.

If those two variables move in VICI’s favor, today’s $26–$27 price could eventually look like an attractive entry point in hindsight.


Investor Disclosure

Disclosure: I own a position in VICI Properties (VICI). This article reflects my personal analysis and is intended for informational and educational purposes only. It is not a recommendation to buy, sell or hold VICI or any other security. I may have a financial interest in the outcome of the analysis. Investors should conduct their own due diligence and consider their individual financial objectives, risk tolerance and investment horizon before making investment decisions.


References

MarketBeat. (2026, July 29). VICI Properties Inc. issues FY 2026 earnings guidance. MarketBeat source

MarketBeat. (2026). VICI Properties (VICI) stock forecast and price target 2026. MarketBeat analyst consensus

MarketScreener. (2026). VICI Properties, Inc.: Target price consensus and analysts recommendations. MarketScreener consensus data

U.S. Securities and Exchange Commission. (2026). VICI Properties Inc. and VICI Properties L.P. annual report on Form 10-K for the year ended December 31, 2025. SEC filing

VICI Properties Inc. (2026, February 25). VICI Properties Inc. announces fourth quarter and full year 2025 results. VICI Properties investor relations

VICI Properties Inc. (2026, July 29). VICI Properties Inc. announces second quarter 2026 results. VICI Properties second-quarter 2026 results

VICI Properties Inc. (2026). Dividends & tax information. VICI Properties dividend information

VICI Properties Inc. (2026). Historical price lookup. VICI Properties historical price data

General Mills ($GIS): High Dividend Yield and Value Potential Draw Investor Attention

GIS, one of the most recognizable consumer staples companies in the United States, has increasingly attracted income-focused investors as its stock price has declined significantly from recent highs. Known for household brands such as Cheerios, Pillsbury, Häagen-Dazs, Betty Crocker, and Blue Buffalo, General Mills now offers one of the highest dividend yields in the packaged food sector.

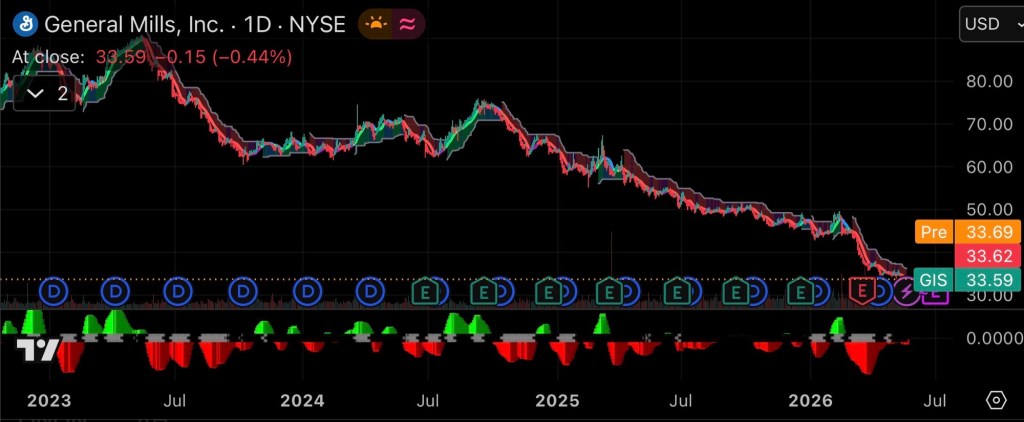
As of May 2026, shares of General Mills are trading near multi-year lows around the mid-$30 range after previously trading above $55 within the past year. The decline has pushed the company’s dividend yield above 7%, a level rarely seen for a mature consumer staples company with decades of dividend history.

Line and bar chart depicting financial growth trends from January to December
A vibrant chart showing fluctuating financial growth trends over a year

Strong Dividend Remains a Key Attraction

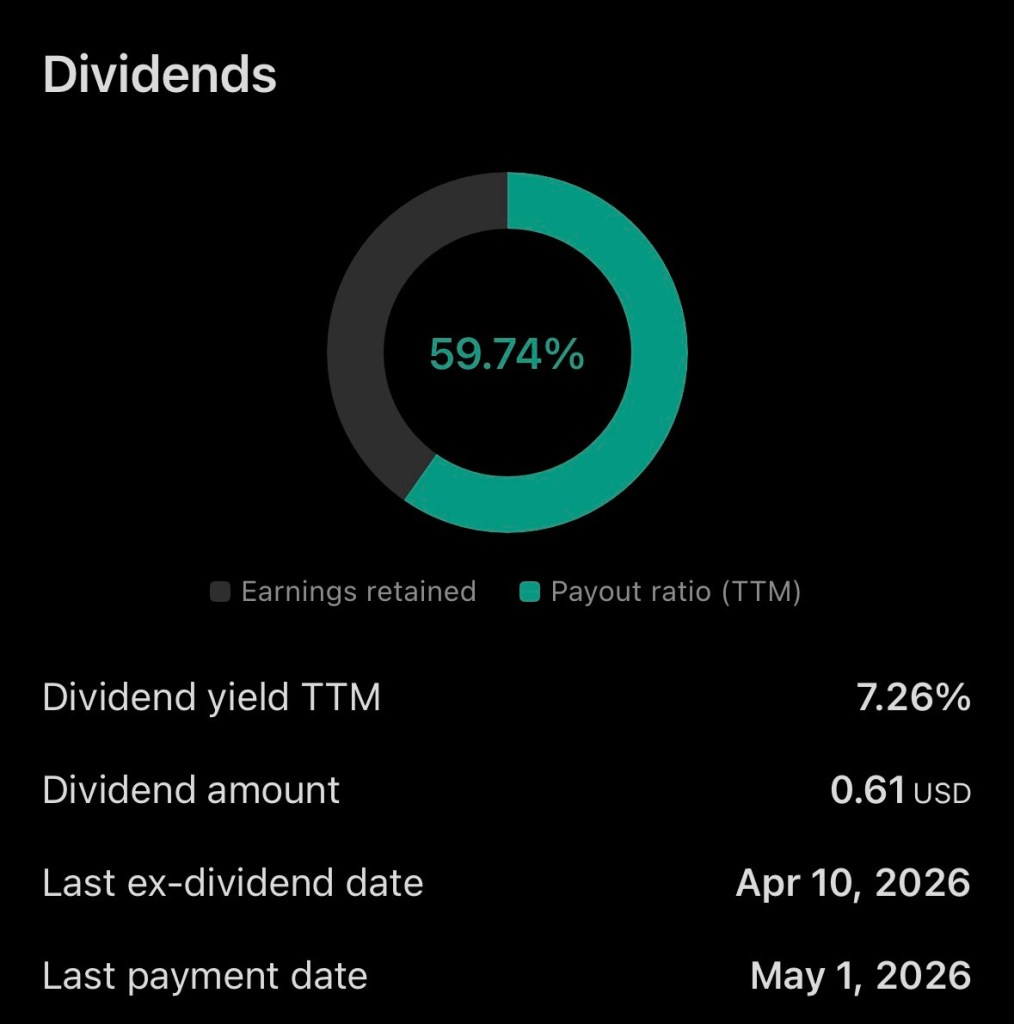
General Mills currently pays an annual dividend of approximately $2.44 per share, translating to a dividend yield above 7%. The company has maintained consistent quarterly dividend payments and has modestly increased its payout in recent years. The payout ratio remains near 60%, which many analysts still consider manageable for a stable consumer products company.

For income investors, the yield alone may make GIS an attractive defensive holding during periods of market volatility and economic uncertainty. Consumer staples companies historically perform better during slower economic periods because consumers continue purchasing essential food products regardless of broader market conditions.

Financial Performance Shows Both Strengths and Challenges

While the dividend remains attractive, General Mills has faced operational headwinds over the past year. Revenue has declined modestly, with trailing twelve-month revenue around $18.4 billion, down more than 6% year-over-year. Earnings and profit margins have also softened as consumers increasingly seek lower-cost alternatives amid inflationary pressures.

The company recently reduced portions of its fiscal 2026 guidance, citing weaker consumer demand and increasing competition from private-label food brands. Management has acknowledged that shoppers are becoming increasingly price sensitive and are prioritizing value-based purchases.

Despite these challenges, General Mills continues to generate substantial cash flow and maintains strong brand recognition across multiple product categories. The company is also investing heavily in innovation, protein-focused products, pet food expansion, and operational efficiencies aimed at improving long-term growth.

Why Some Investors See Upside Potential

Although sentiment surrounding GIS has weakened, several valuation metrics suggest the stock could offer upside potential at current levels.

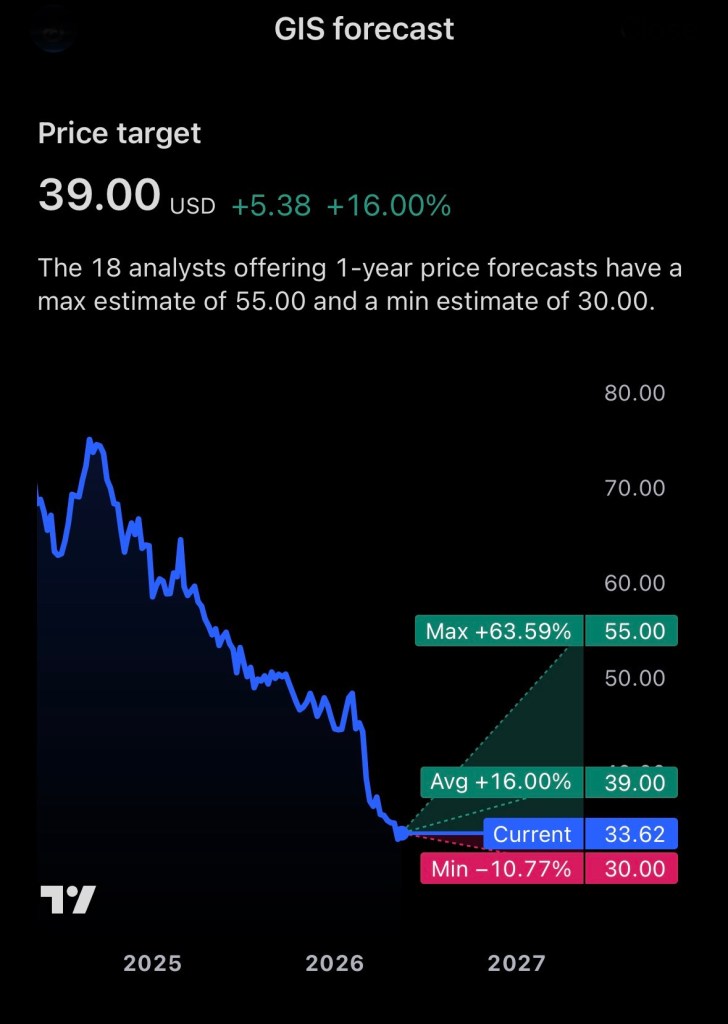
General Mills currently trades at a price-to-earnings ratio below 9, substantially lower than many competitors in the consumer staples sector. Analyst price targets average around $42 per share, implying potential upside of nearly 18% from recent trading levels.

Bullish investors argue that much of the negative outlook may already be reflected in the current stock price. If inflation moderates, consumer spending stabilizes, and management successfully executes its growth initiatives, GIS could potentially see both earnings stabilization and multiple expansion over the next 12 to 24 months.

Additionally, the combination of a high dividend yield and possible capital appreciation may appeal to long-term dividend growth investors seeking total return opportunities.

Risks Investors Should Monitor

Despite the attractive valuation and dividend yield, risks remain. Persistent inflation, changing consumer habits, private-label competition, and margin compression could continue pressuring earnings. The packaged food industry also faces ongoing challenges from shifting dietary preferences and increased competition from health-focused brands.

Investors should also monitor debt levels, input cost inflation, and whether the company can successfully restore organic sales growth over upcoming quarters.

Final Thoughts

General Mills appears to represent a classic value-versus-growth debate. The company is no longer viewed as a high-growth stock, but its depressed valuation, established global brands, and substantial dividend yield could present an opportunity for patient investors willing to accept slower growth and near-term volatility.

For dividend-focused portfolios, GIS may warrant consideration as a high-income consumer staples holding, particularly if management can stabilize sales trends and maintain strong free cash flow generation.

Disclosure

The author currently owns a position in General Mills ($GIS). This article is for informational purposes only and should not be considered financial advice. Investors should conduct their own research before making investment decisions.

References (APA Format)

MacroTrends. (2026). General Mills revenue 2012–2026. Retrieved May 21, 2026, from MacroTrends

Reuters. (2026, February 17). General Mills’ forecast cut from demand hit rattles packaged-food stocks. Retrieved May 21, 2026, from Reuters

Stock Analysis. (2026). General Mills (GIS) dividend history, dates & yield. Retrieved May 21, 2026, from Stock Analysis Dividend Page

Stock Analysis. (2026). General Mills (GIS) financials & income statement. Retrieved May 21, 2026, from Stock Analysis Financials

Stock Analysis. (2026). General Mills (GIS) stock price & overview. Retrieved May 21, 2026, from Stock Analysis Overview

MarketWatch. (2026). Cheerios parent General Mills says it will sacrifice some profit to drive sales amid cautious consumers. Retrieved May 21, 2026, from MarketWatch Article

Enterprise Products Partners (EPD): High-Yield Stability Meets Measured Growth in 2026

Enterprise Products Partners L.P. (NYSE: EPD), one of the largest midstream energy operators in North America, continues to attract income-focused investors in 2026 with a combination of steady cash flows, a strong dividend track record, and modest but reliable growth prospects.

Power plant with cooling towers and electrical substation with transmission lines at sunset
A power plant surrounded by transmission towers during a vibrant sunset

Stock Performance and Current Price

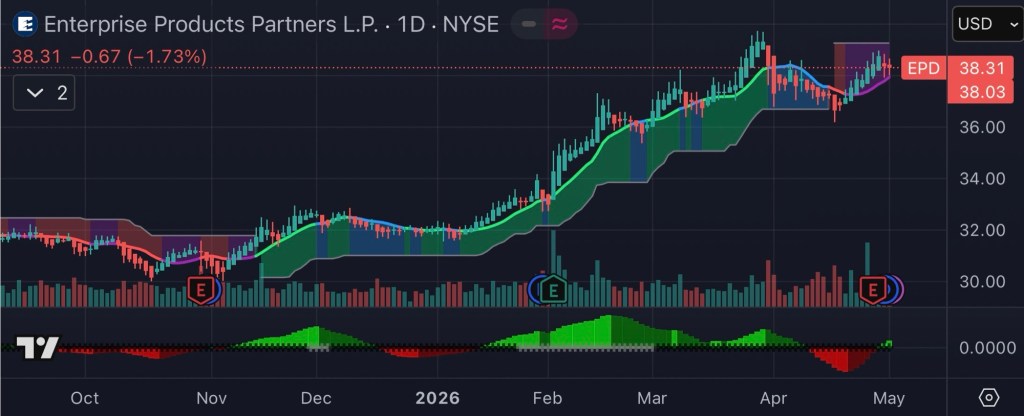
As of late April 2026, EPD shares are trading in the mid-to-high $30 range (approximately $36–$38 per unit), slightly below analyst consensus targets near $39.50.

The stock has demonstrated resilience this year, gaining over 20% year-to-date amid improving fundamentals and renewed investor interest in energy infrastructure assets.

Despite some short-term volatility and minor earnings misses, the broader trend remains constructive, supported by stable demand for oil, natural gas liquids (NGLs), and export services.

Dividend Profile: A Core Income Play

Enterprise Products Partners remains a standout in the income investing space:

  • Annual distribution: ~$2.20 per unit
  • Quarterly payout: $0.55
  • Dividend yield: ~5.8%–6.0%
  • Dividend growth streak: 28 consecutive years

The company recently reaffirmed its quarterly distribution for 2026, reflecting a ~2–3% year-over-year increase, consistent with its conservative capital return strategy.

Unlike high-growth equities, EPD prioritizes distribution stability and coverage, maintaining payout ratios supported by strong operating cash flow.

Financial Strength and Operational Momentum

Recent earnings and operational data highlight steady performance:

  • Q1 2026 EBITDA: ~$2.7 billion
  • Operating income growth: +8%
  • Revenue beat expectations despite EPS miss

Enterprise’s diversified asset base spanning pipelines, storage, processing, and export terminals continues to generate predictable fee-based income, insulating the business from commodity price volatility.

Growth Outlook: Moderate in 2026, Stronger Beyond

Looking ahead, analysts expect measured growth in 2026, with stronger acceleration into 2027:

  • 2026 outlook: Transitional year with stable cash flow
  • 2027+: Potential double-digit EBITDA and cash flow growth as new projects come online
  • Capital projects pipeline: ~$6 billion in infrastructure investments

Wall Street forecasts also indicate gradual earnings expansion:

  • 2026 estimated earnings: ~$6.1B
  • 2027 estimated earnings: ~$6.8B

This positions EPD as a “slow compounder” rather than a high-growth equity ideal for long-term income portfolios.

Key Investment Highlights

MetricValue / Insight
Current Stock Price~$36–$38
Dividend Yield~5.8%–6.0%
Annual Distribution~$2.20
Dividend Growth Streak28 years
2026 Stock Performance~+20% YTD
EBITDA (Q1 2026)~$2.7B
Growth OutlookModerate 2026, stronger 2027+
Analyst Target~$39.50

Investment Thesis

Enterprise Products Partners continues to deliver on its core value proposition: reliable income with low volatility and gradual capital appreciation.

Bull Case:

  • Durable, fee-based midstream business model
  • Strong balance sheet and distribution coverage
  • High yield relative to broader equity markets
  • Visible long-term growth pipeline

Bear Case:

  • Limited near-term upside due to mature asset base
  • Slower dividend growth compared to peers
  • Sensitivity to energy demand cycles and interest rates

Bottom Line

For 2026, Enterprise Products Partners is best viewed as a defensive income vehicle rather than a growth stock. Investors seeking consistent yield and stability in uncertain markets may find EPD particularly attractive, while those pursuing aggressive capital gains may look elsewhere.

With a near-6% yield, a decades-long dividend track record, and improving long-term growth catalysts, EPD remains a cornerstone holding in the midstream energy sector.

Disclosure Statement

Disclosure: The author currently holds a position in Enterprise Products Partners L.P. (NYSE: EPD). This article is for informational purposes only and should not be considered financial advice. Investors should conduct their own due diligence or consult a licensed financial professional before making investment decisions.


References (APA Format)

Yahoo Finance. (2026). Enterprise Products Partners L.P. (EPD) stock price, news, and analysis. Retrieved May 2, 2026, from https://finance.yahoo.com/

MarketBeat. (2026). Enterprise Products Partners dividend history and yield. Retrieved May 2, 2026, from https://www.marketbeat.com/

Simply Wall St. (2026). Enterprise Products Partners distribution updates and analysis. Retrieved May 2, 2026, from https://simplywall.st/

Intellectia. (2026). Enterprise Products Partners starts 2026 strong with stock gains. Retrieved May 2, 2026, from https://intellectia.ai/

The Motley Fool. (2026). Energy dividend stocks outlook and analysis. Retrieved May 2, 2026, from https://www.fool.com/

Seeking Alpha. (2026). Enterprise Products Partners: Growth outlook and capital projects. Retrieved May 2, 2026, from https://seekingalpha.com/

WallStreetZen. (2026). EPD stock forecast and earnings projections. Retrieved May 2, 2026, from https://www.wallstreetzen.com/

Mastering Dollar-Cost Averaging for Long-Term Wealth

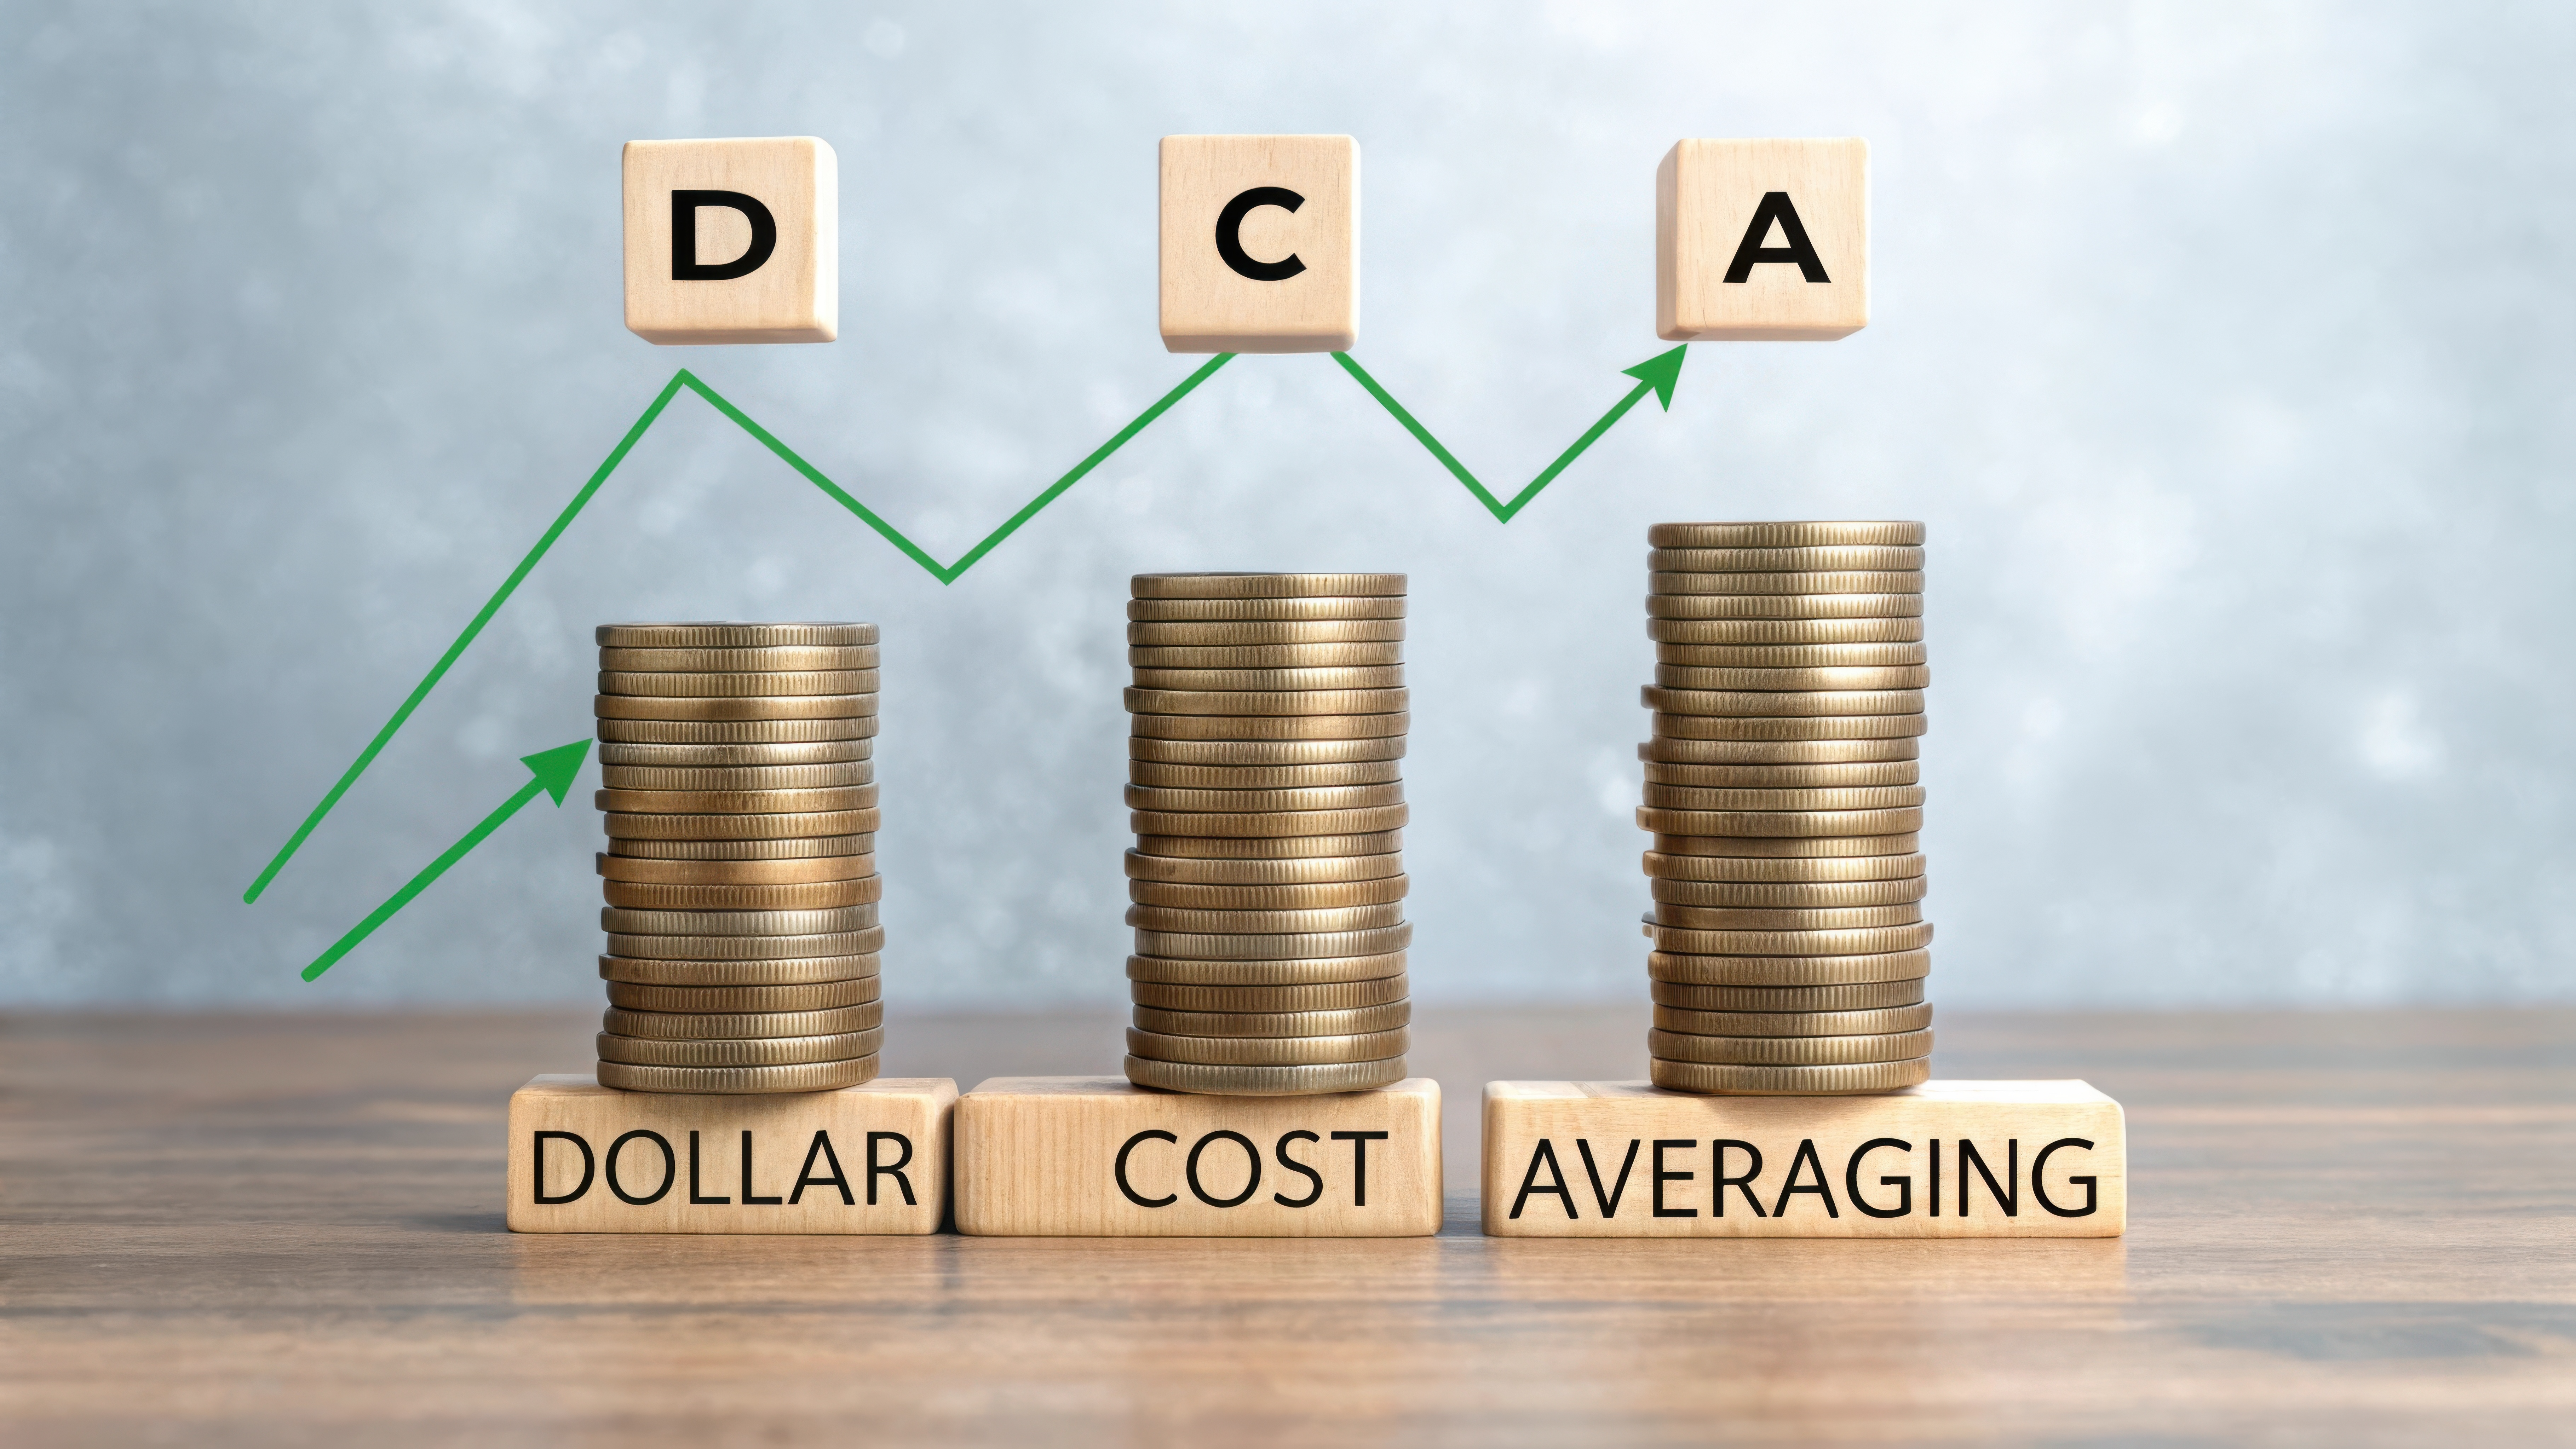
For many investors, the most difficult part of building wealth in the stock market is not choosing the right company it is deciding when to invest. Market volatility, headlines, and fear of buying at the “wrong time” often cause investors to sit on the sidelines. Dollar-cost averaging (DCA) offers a straightforward solution to this problem, making it one of the easiest and most effective ways to ease into a stock position for long-term investing.

What Is Dollar-Cost Averaging?

Dollar-cost averaging is an investment strategy where an investor commits to investing a fixed dollar amount into a stock, exchange-traded fund (ETF), or mutual fund at regular intervals such as weekly, biweekly, or monthly regardless of the asset’s price.

Instead of investing a lump sum all at once, DCA spreads purchases over time. When prices are high, the fixed dollar amount buys fewer shares. When prices are low, the same amount buys more shares. Over time, this approach results in an average purchase price that reflects market fluctuations rather than a single entry point.

Why DCA Works for Long-Term Investors

1. Reduces Market Timing Risk
Trying to time the market consistently is extremely difficult, even for professionals. Dollar-cost averaging removes the pressure to predict short-term price movements. By investing consistently, investors participate in the market regardless of temporary highs or lows.

2. Eases Emotional Decision-Making
Emotions such as fear and greed often lead to poor investment decisions. DCA introduces discipline by turning investing into a routine process rather than a reaction to market news. This structure helps investors stay invested during periods of volatility, which are critical for long-term success.

3. Smooths Volatility Over Time
Markets are inherently volatile in the short term. DCA naturally takes advantage of price swings by purchasing more shares during market pullbacks. Over long periods, this can lower the average cost per share compared to investing all funds at a single market peak.

4. Encourages Consistent Investing Habits
Dollar-cost averaging aligns well with regular income cycles, such as paychecks. This makes it easier for investors to build positions gradually without waiting for large sums of capital. Consistency is a key driver of long-term portfolio growth.

Why DCA Is Ideal for Easing Into a Stock Position

For investors initiating a new stock position, especially in a volatile or uncertain market, DCA provides a measured and controlled entry. Rather than committing all capital at once, investors can scale into the position over months or even years, allowing the investment thesis to play out while limiting short-term downside risk.

This approach is particularly effective for:

  • Long-term growth stocks
  • Broad market ETFs
  • Retirement and taxable investment accounts
  • Investors new to the market or returning after a pullback

Long-Term Results Matter More Than Perfect Timing

While lump-sum investing can outperform in steadily rising markets, dollar-cost averaging shines when volatility is present an increasingly common feature of modern markets. More importantly, DCA helps investors stay invested, which historically has mattered far more than finding the perfect entry point.

Over time, markets have demonstrated an upward bias driven by earnings growth, innovation, and economic expansion. Dollar-cost averaging allows investors to participate in that long-term trend without the stress of short-term market noise.

The Last Word

Dollar-cost averaging is not about maximizing short-term gains it is about building wealth steadily and responsibly. By reducing timing risk, minimizing emotional mistakes, and encouraging consistent participation, DCA stands out as one of the simplest and most effective strategies for easing into a stock position and staying committed to long-term investing goals.

For investors focused on patience, discipline, and long-term growth, dollar-cost averaging remains a proven and accessible strategy in any market environment.

Why Invest in Cohen & Steers $UTF During Market Downturns

Cohen & Steers Infrastructure Fund, Inc. (ticker: UTF) is a closed-end fund that invests primarily in listed infrastructure companies utilities, pipelines, toll roads, telecoms and similar businesses with an emphasis on income and total return. The fund targets at least 80% exposure to infrastructure securities and is permitted to hold preferreds and fixed-income as well. (Cohen & Steers+1)

The case for UTF in a downturn

  1. High and steady monthly distribution. UTF pays a monthly cash distribution (recently about $0.155 per share) that translates to a forward annualized dividend around the high-single to mid-single digits (roughly a 7–8% yield at current market prices). That regular payout can make UTF attractive to income-seeking investors during equity market weakness. (Cohen & Steers Resources+1)
  2. Defensive underlying exposure. Infrastructure companies often provide essential services (power, water, roads, telecom) with relatively stable cash flows and regulatory protections that can soften downside in economic contractions compared with cyclical sectors. UTF’s strategy explicitly focuses on these companies and includes income-oriented holdings (common equity plus a portion in preferreds/fixed income). (SEC+1)
  3. Closed-end structure can add opportunity. As a closed-end fund, UTF can trade at a premium or discount to net asset value (NAV) and use leverage or share repurchases to enhance returns. In downturns, discounts can widen and create potential buying opportunities for investors seeking yield and income—though discounts can also persist. Recent fund documents show management tools (repurchase programs, rights offerings) are in use when needed. (Cohen & Steers+1)
  4. Relative price stability historically. While all market securities fall in tough selloffs, UTF’s share price history shows less extreme volatility than many small-cap or tech names because of its income focus and infrastructure holdings. (See sources below for historical price and distribution history.) (Yahoo Finance+1)
  5. Total-return potential from dividends + capital. In a downturn the regular dividend cushions total returns. If the portfolio’s underlying cash flows remain intact, the dividend can provide an attractive yield while capital recoveries occur — particularly for buy-and-hold income investors.

Risks you must weigh

  • Discount/premium risk: CEFs can trade at large, persistent discounts to NAV; the market price might not reflect NAV recovery quickly. (CEF Connect)
  • Leverage and interest-rate sensitivity: Some closed-end funds use leverage that can magnify losses when markets fall and can increase sensitivity to rising rates. UTF’s prospectus and factsheet discuss leverage and fixed-income exposure. (Cohen & Steers Resources+1)
  • Concentration risk: Heavy exposure to infrastructure and related subsectors means sector-specific shocks (regulatory, energy shocks, etc.) can hit performance. (SEC)

Current snapshot (load-bearing facts)

  • Market price (recent close): roughly $24.20. (Yahoo Finance)
  • Forward annualized dividend / distribution: roughly $1.86 per share (monthly payments ≈ $0.155) — forward yield around 7–8% at current prices. (StockAnalysis+1)
  • Investment objective: total return with emphasis on income; invests at least 80% in infrastructure securities. (SEC+1)

12-month stock-price projection (company/analyst estimates-style scenarios)

Analysts don’t always publish a single consensus price target for closed-end funds like UTF; where a consensus target isn’t available, a scenario approach is often more informative. Below I created three plausible projected price scenarios for the next 12 months — Bear (–15% y), Baseline (+4% y) and Bull (+25% y) — starting from the recent market close (~$24.20). These are illustrative projections (not predictions or investment advice), intended to show how price paths and total return dynamics might look under different macro/backdrop outcomes.

Key assumptions used for the chart: start price $24.20, monthly compounding equivalent to the annual scenario rates listed above. These scenarios do not include dividends — they show market-price outcomes only (adding dividends would materially improve total returns, especially at a ~7–8% yield).


Quick takeaways

  • UTF’s monthly dividend and exposure to essential infrastructure make it a reasonable consideration for income-focused investors during market downturns; the dividend can provide cashflow support while equity markets recover. (Cohen & Steers Resources+1)
  • However, because UTF is a closed-end fund, price movements can diverge from underlying NAV and be influenced by fund-specific factors (discounts, leverage, corporate actions). That tradeoff (high yield vs. structural CEF risks) is central to whether UTF is appropriate for any individual portfolio. (Cohen & Steers+1)

Disclosure

I currently hold a position in the Cohen & Steers Infrastructure Fund (UTF). This information is provided for educational and informational purposes only and should not be considered financial advice. Always conduct your own research and consult with a qualified financial professional before making any investment decisions.

References

Cohen & Steers. (n.d.). Cohen & Steers Infrastructure Fund (UTF). Retrieved from https://www.cohenandsteers.com/

Cohen & Steers. (n.d.). UTF: Cohen & Steers Infrastructure Fund—Fact sheet. Cohen & Steers. (Original fund literature.)

Dividend.com. (n.d.). UTF dividend history: Cohen & Steers Infrastructure Fund. Retrieved from https://www.dividend.com/

DividendMax. (n.d.). Cohen & Steers Infrastructure Fund dividend information. Retrieved from https://www.dividendmax.com/

SEC. (n.d.). Cohen & Steers Infrastructure Fund, Inc. (UTF) — Prospectus & filings. U.S. Securities and Exchange Commission. Retrieved from https://www.sec.gov/

StockAnalysis.com. (n.d.). UTF: Cohen & Steers Infrastructure Fund stock dividend & history. Retrieved from https://stockanalysis.com/

Yahoo Finance. (n.d.). UTF — Cohen & Steers Infrastructure Fund price & chart data. Retrieved from https://finance.yahoo.com/

Exploring Investment Strategies: How to Start with Just $1,000

Many people believe you need a large sum of money to start investing, but the truth is you can begin building wealth with as little as $1,000. The key lies in choosing the right strategy that fits your goals, risk tolerance, and timeline.

1. Index Funds

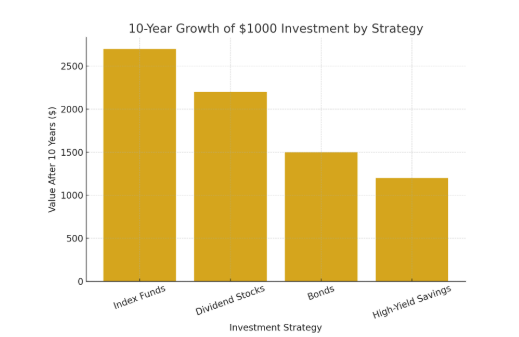
Index funds are one of the simplest and most effective ways to invest. By tracking the performance of a broad market index (like the S&P 500), they offer diversification and steady long-term growth. Historically, index funds have returned around 7–10% annually. With $1,000 invested, the potential compound growth over 10 years could more than double your money.

2. Dividend Stocks

Dividend-paying stocks provide the dual benefit of potential stock price appreciation and regular income through dividend payouts. This strategy appeals to investors who want to generate passive income while also building long-term value. Though returns may vary, reinvesting dividends can accelerate portfolio growth.

3. Bonds

For those seeking stability, bonds remain a trusted option. While the returns are lower compared to stocks, they provide predictable income and are less volatile. A $1,000 bond investment won’t skyrocket in value, but it can help protect capital while earning modest interest.

4. High-Yield Savings Accounts

Technically not an investment in the traditional sense, high-yield savings accounts are a safe place to grow your money while maintaining liquidity. While returns are the smallest of the group, they offer security and immediate access to funds, which is ideal for short-term goals.

Bottom Line

Starting with $1,000 may not make you rich overnight, but it sets the foundation for long-term financial growth. By choosing a strategy that aligns with your needs—whether it’s the steady growth of index funds, the income from dividends, the safety of bonds, or the liquidity of savings—you can begin your journey to building wealth today.