Over the past few years here, one thing has become clear: the topics that matter most are the ones that impact everyday people in real life. From protecting families financially to improving personal health and building long-term wealth, the conversations shared across social media have focused on practical advice, real experiences, and personal growth.
Here’s a look back at some of the biggest themes that resonated with readers and followers alike.

Insurance Isn’t Just a Bill… It’s a Financial Safety Net
One recurring topic has been the importance of understanding insurance beyond the monthly premium. Conversations around auto insurance scores, homeowner protection, life changes, and shopping for coverage highlighted how important it is to make informed decisions.
Many drivers don’t realize that constantly switching insurance companies can sometimes hurt their long-term pricing and stability. Insurance history, payment consistency, claim frequency, and credit-related factors often play a role in how rates are calculated. The key message shared over time has been simple:
✅ Shop smart
✅ Compare coverage… not just price
✅ Understand what you’re buying
✅ Protect yourself before problems happen
There were also important discussions about protecting families after the loss of a spouse. Topics included updating estate documents, reviewing beneficiaries, adjusting homeowners and auto insurance policies, and making sure financial accounts are organized during difficult times.
Health and Sleep Matter More Than We Admit
Another major focus centered around health and quality of life, especially sleep.
Personal experiences discussing CPAP therapy opened conversations for many people struggling silently with exhaustion, poor sleep quality, and untreated sleep apnea. The message was relatable because it focused on real-life improvements instead of medical jargon.
Many readers connected with the idea that better sleep can improve:
- Energy levels
- Mood and mental clarity
- Blood pressure
- Productivity
- Overall quality of life
The discussions also honestly addressed the adjustment period that comes with CPAP use, reminding people that long-term health improvements often require patience and consistency.
Mental Health Conversations Continue to Break Stigma
Mental health awareness became another important topic throughout the years. Rather than focusing only on diagnoses or labels, the message centered around perseverance, growth, and finding purpose despite difficult seasons.
The overall tone remained encouraging:
Every day is another opportunity to keep moving forward.
Readers responded positively to honest conversations about stress, emotional struggles, and the importance of seeking support while continuing to pursue productive and meaningful lives.
Investing Conversations Focused on Long-Term Thinking
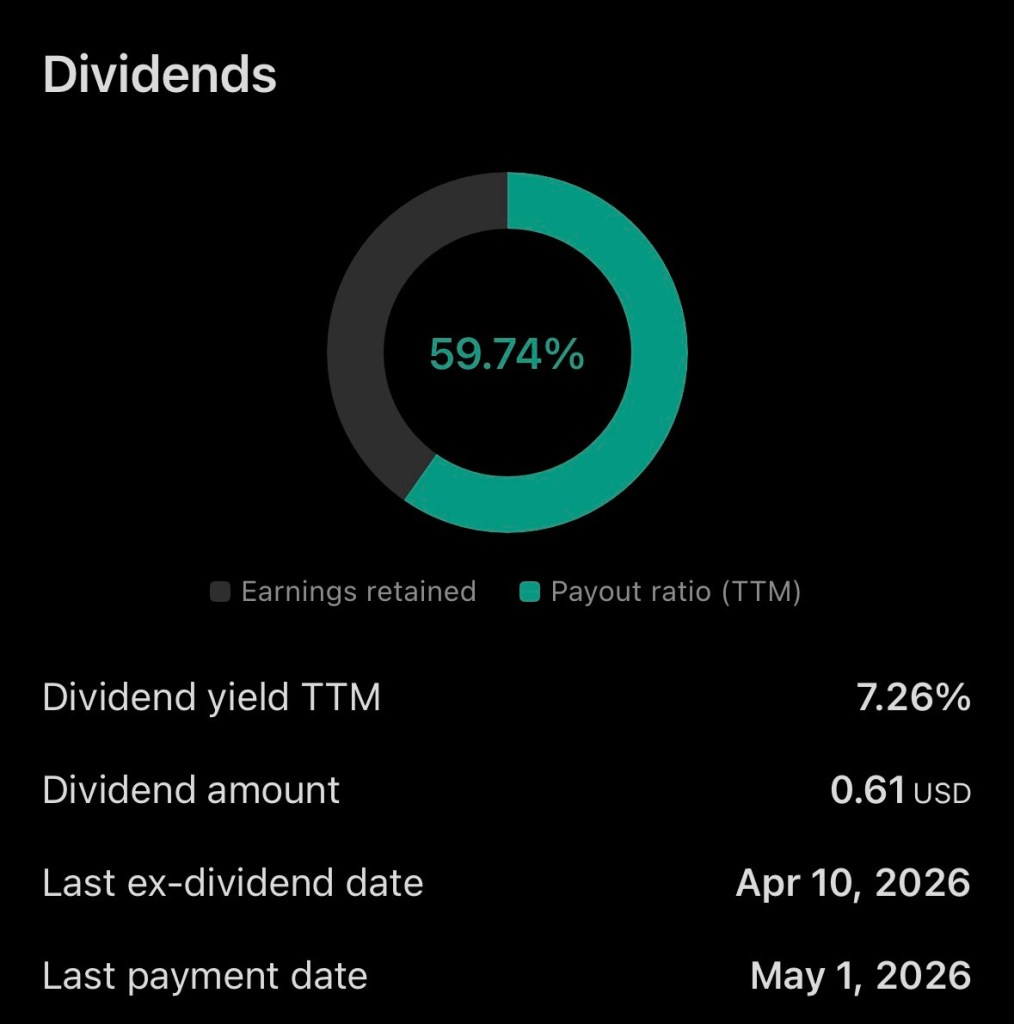
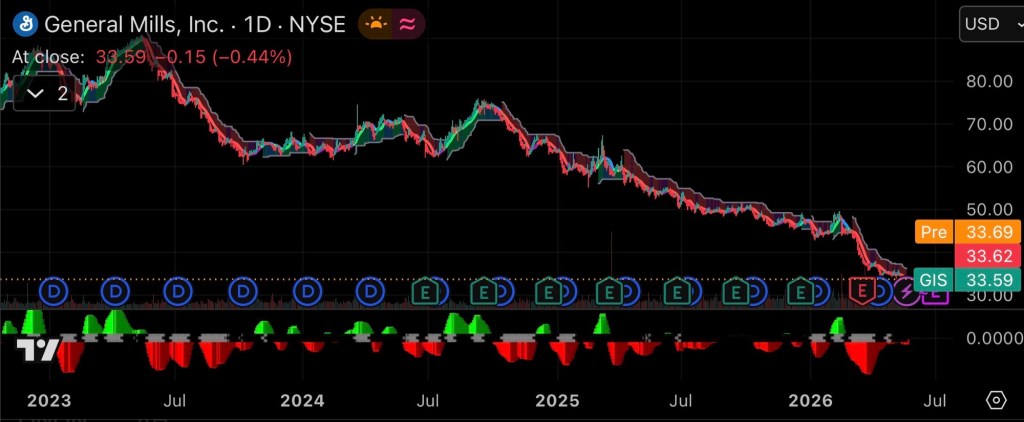
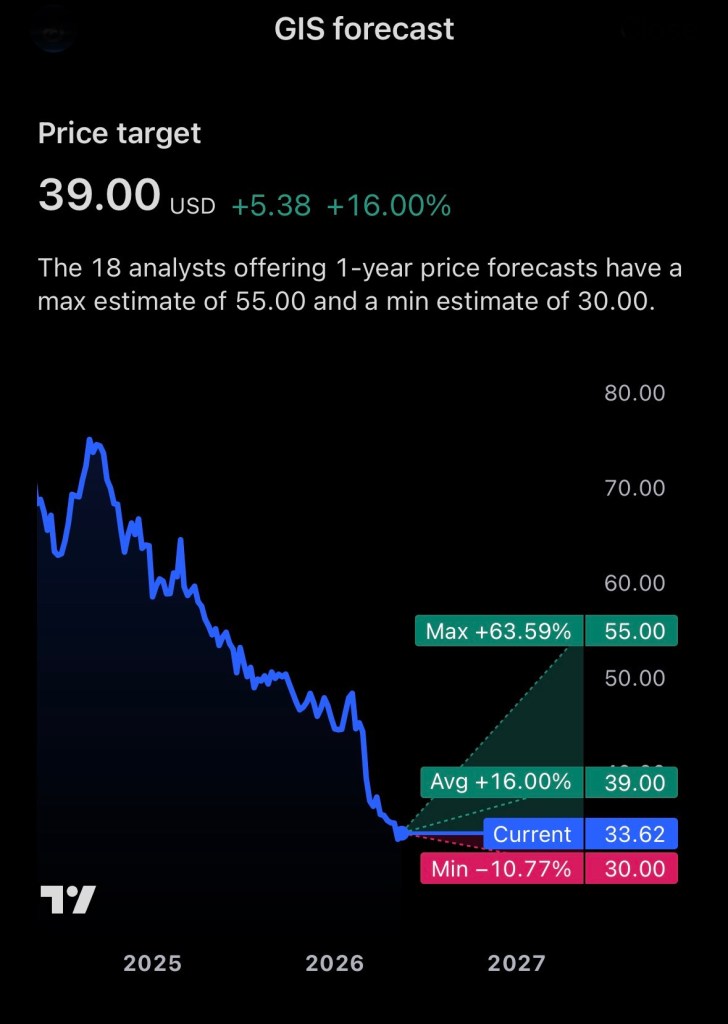
Investment-related discussions also attracted strong engagement, especially around dividend-paying companies and emerging growth opportunities.
Articles and commentary involving companies like General Mills (GIS) and Ondas Holdings (ONDS) explored the balance between stability and growth potential.
Topics included:
- Dividend investing
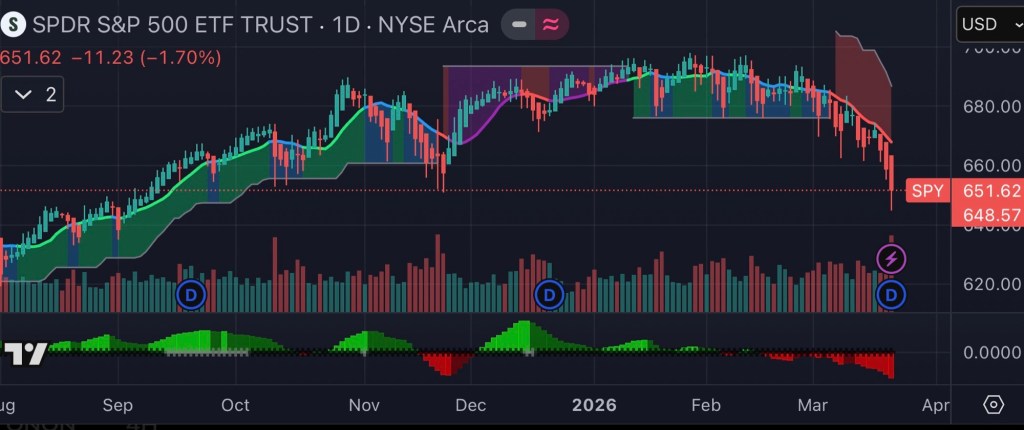
- Market volatility
- Long-term portfolio strategy
- Risk management
- Emerging technology opportunities
One consistent theme stood out:
📈 Investing is not about chasing hype every day it’s about building disciplined habits over time.
Transparency also remained important, with disclosures shared whenever positions in discussed companies were personally owned.

Technology, Sustainability, and Everyday Innovation
Discussions around sustainability and technology showed how rapidly the world is changing. Topics ranged from electric vehicles and smart homes to how innovation is reshaping the insurance industry itself.
As more households adopt connected devices and cleaner technologies, conversations emphasized how these changes may impact:
- Insurance pricing
- Risk assessment
- Home safety
- Driving habits
- Long-term financial savings
The growing overlap between technology and personal finance continues to create opportunities for consumers willing to stay informed.
Why These Conversations Connected With People
The reason these topics gained attention is because they were grounded in real life.
They weren’t just about headlines or trends they focused on:
✔ Protecting families
✔ Improving health
✔ Building financial stability
✔ Encouraging personal growth
✔ Preparing for the unexpected
In a social media environment often dominated by negativity and noise, practical conversations that educate, encourage, and empower people continue to stand out.
Key Takeaway
Over the years, these discussions have shown that everyday decisions can have a lasting impact. Whether it’s reviewing an insurance policy, improving sleep, investing for the future, or simply finding ways to stay positive during difficult times, small steps often create meaningful long-term results.
The conversations will continue because life keeps evolving, and staying informed matters more than ever.