The artificial intelligence revolution has created a new generation of technology winners, and few companies have captured investor attention as quickly as CoreWeave (NASDAQ: CRWV). Since its public debut in 2025, CoreWeave has transformed from a niche cloud computing provider into one of the most closely watched AI infrastructure companies in the market.
As demand for artificial intelligence computing continues to accelerate, investors are asking a simple question: Does CoreWeave still have room to run?
A Brief History of CoreWeave
CoreWeave was founded in 2017 and originally focused on cryptocurrency mining infrastructure. As demand for high-performance computing evolved, management pivoted toward providing specialized cloud infrastructure powered by NVIDIA graphics processing units (GPUs). That decision would prove transformational.
The company went public on the Nasdaq under the ticker CRWV in March 2025, pricing its initial public offering at $40 per share and raising approximately $1.5 billion to expand its AI cloud platform.
Since then, CoreWeave has become one of the leading providers of AI-focused cloud infrastructure, serving customers that require enormous amounts of computing power for training and operating large language models and other AI applications.
What’s Driving the Stock?
Several developments have fueled investor enthusiasm during 2026.
Most notably, CoreWeave became the first cloud provider to deploy NVIDIA’s new Vera Rubin NVL72 AI systems, reinforcing its position at the forefront of next-generation AI infrastructure. The announcement helped drive a significant rally in the stock and further strengthened the company’s strategic relationship with NVIDIA.
Earlier this year, NVIDIA expanded its partnership with CoreWeave and invested an additional $2 billion in the company. The two firms announced plans to accelerate the development of large-scale AI infrastructure and AI factories over the coming decade.
The company has also reported remarkable growth in customer demand. CoreWeave disclosed a revenue backlog of approximately $99.4 billion as of March 31, 2026, providing significant visibility into future revenue streams. Major customers include some of the largest names in artificial intelligence and cloud computing.
The Bull Case: Why Investors Remain Excited
Several factors support the bullish argument for CoreWeave.
Explosive AI Demand
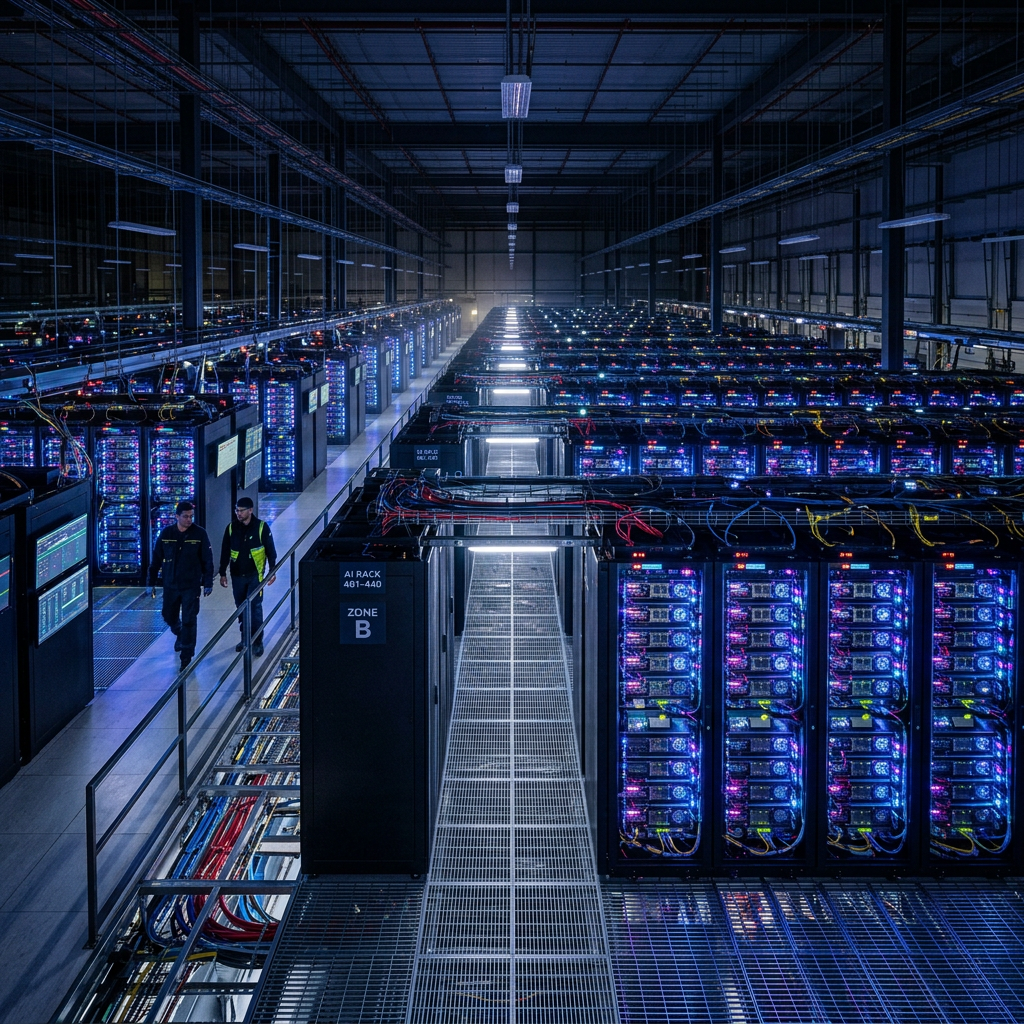
Artificial intelligence remains one of the fastest-growing sectors in technology. Companies are racing to build increasingly sophisticated AI models, and all of them require massive amounts of computing power. CoreWeave’s infrastructure is specifically designed to meet that demand.
Strategic NVIDIA Relationship
Few companies have a closer relationship with NVIDIA than CoreWeave. Access to next-generation hardware before competitors could provide a significant advantage as AI workloads continue to grow.
Massive Revenue Backlog
A backlog approaching $100 billion gives investors confidence that demand remains strong despite concerns about the broader economy. Few newly public companies can point to this level of contracted business.
Industry Leadership
CoreWeave has established itself as one of the premier “AI-native” cloud providers. As enterprises increasingly adopt AI, the company may be positioned to capture a growing share of infrastructure spending.
The Bear Case: Risks Investors Should Consider
Despite its impressive growth, CoreWeave is not without risks.
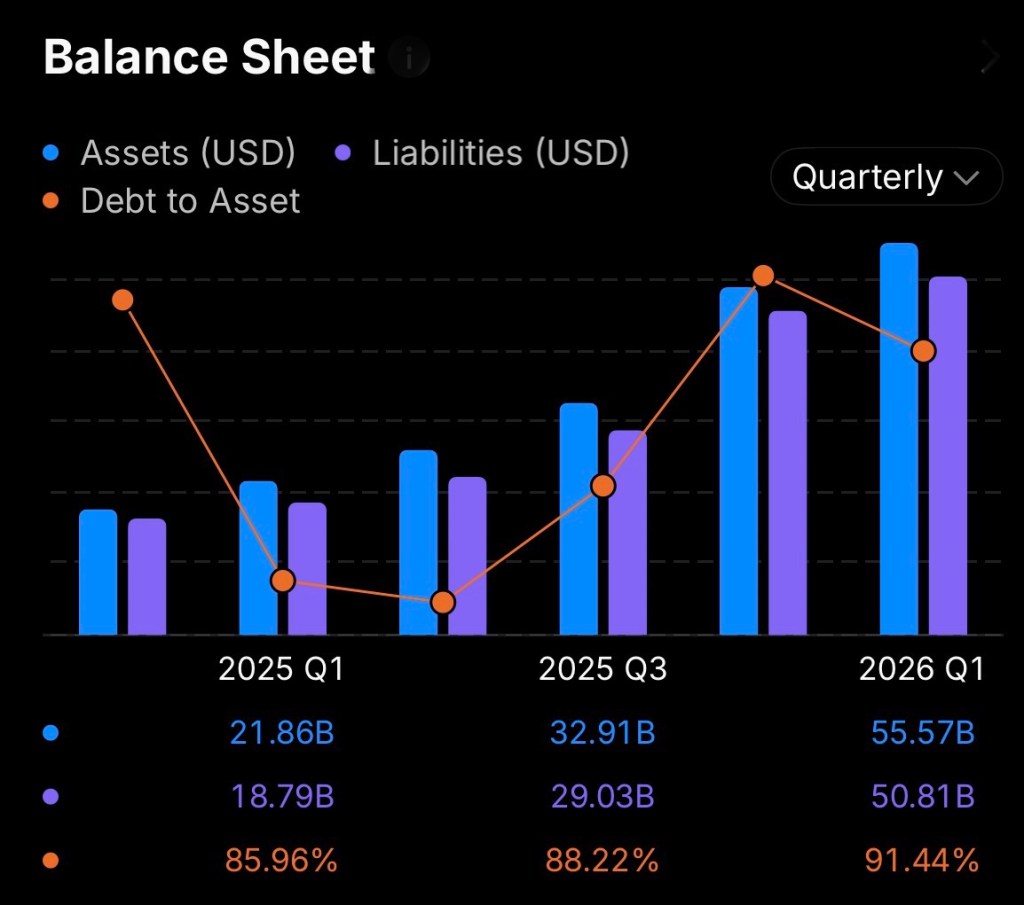
Capital Intensive Business Model
Building AI infrastructure is extraordinarily expensive. CoreWeave continues to spend billions on data centers, GPUs, and power capacity. Management recently increased its capital expenditure outlook as demand for AI hardware continues to surge.
Profitability Remains a Challenge
Although revenue growth has been exceptional, the company continues to report significant net losses. Investors are betting that future scale will eventually generate substantial profits. If growth slows before profitability improves, valuation concerns could emerge.
Customer Concentration
A meaningful portion of CoreWeave’s business comes from large AI companies and hyperscale cloud providers. Any reduction in spending from major customers could affect future growth rates.
Valuation Risk
Many AI-related companies trade at premium valuations based on expectations of future growth. If the AI spending cycle cools or investors become more cautious, high-growth stocks like CoreWeave could experience significant volatility.
Is There Still Upside Ahead?
The answer largely depends on whether investors believe AI infrastructure demand will continue expanding over the next decade.
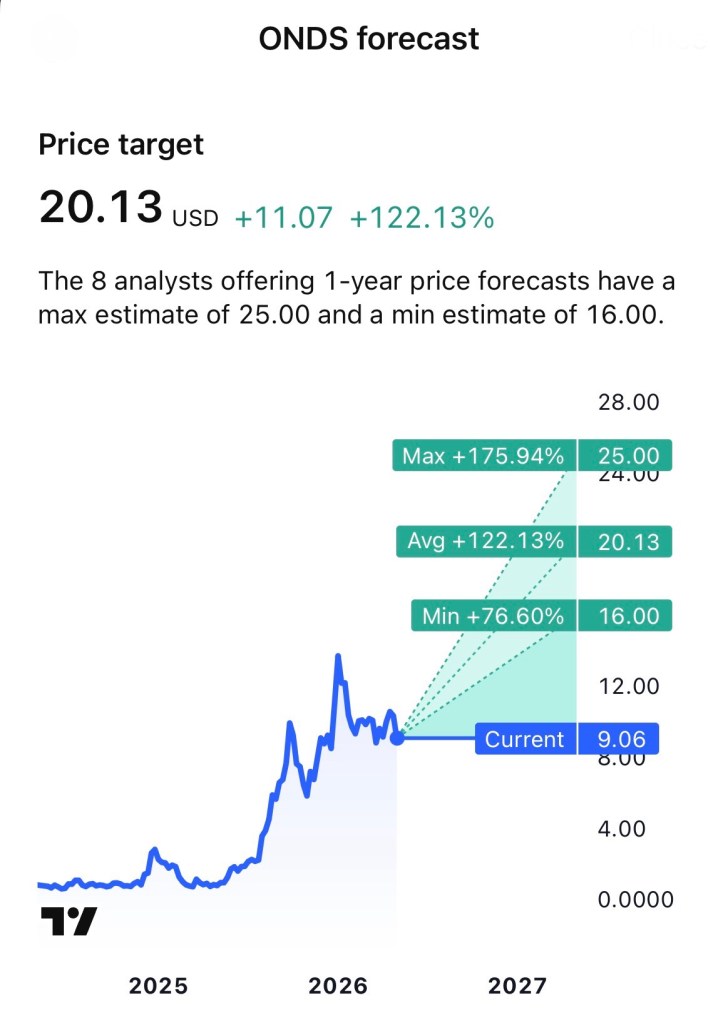
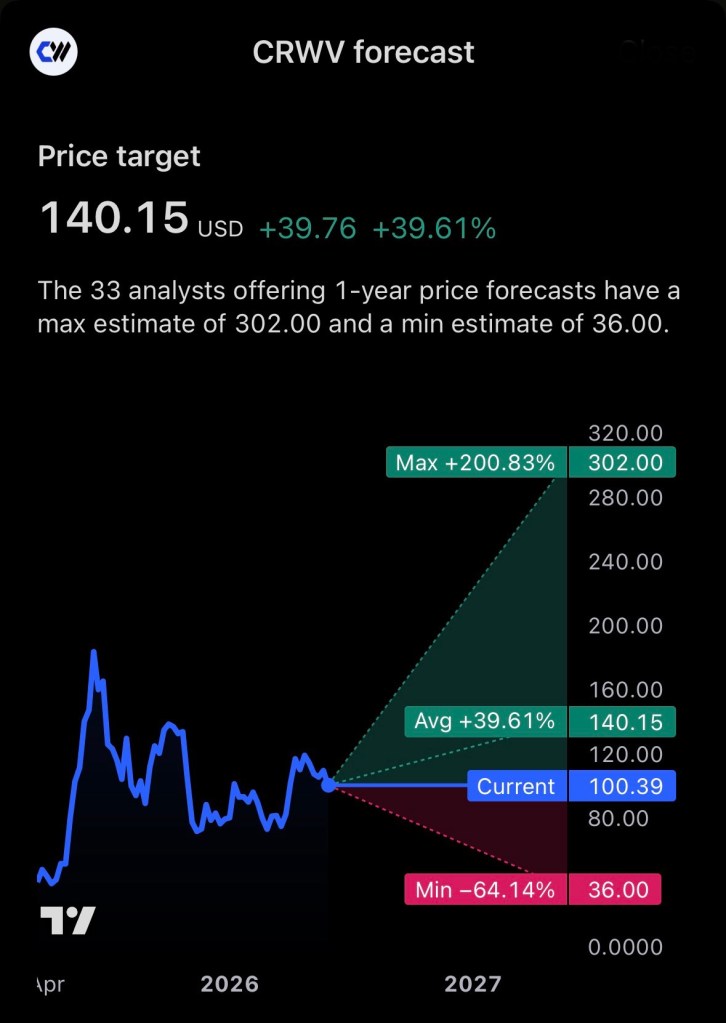
Supporters argue that artificial intelligence is still in its early innings and that the demand for compute power will continue to grow exponentially. If that thesis proves correct, CoreWeave could remain one of the primary beneficiaries of the AI buildout. Recent analyst targets and market commentary suggest many on Wall Street still see meaningful upside potential from current levels.
However, investors should recognize that CoreWeave remains a high-growth, high-risk company. The business must continue executing flawlessly while managing enormous capital expenditures and eventually demonstrating sustained profitability.
Bottom Line
CoreWeave has rapidly emerged as one of the most important infrastructure providers powering the AI revolution. The company’s strategic relationship with NVIDIA, enormous revenue backlog, and leadership position in AI cloud computing have helped fuel investor enthusiasm.
While the stock may continue to benefit from the expanding AI ecosystem, investors should remember that rapid growth often comes with substantial volatility. CoreWeave represents both the promise and the risks of investing in one of the market’s most exciting sectors.
For investors willing to tolerate uncertainty, CRWV remains one of the purest publicly traded plays on the future of artificial intelligence infrastructure.
Disclosure
The author owns shares of CoreWeave (NASDAQ: CRWV). This article is for informational and educational purposes only and should not be considered investment advice. Investors should conduct their own research and consult a qualified financial advisor before making investment decisions.
References
- CoreWeave. (2025, March 27). CoreWeave announces pricing of initial public offering. Retrieved from CoreWeave Investor Relations
- CoreWeave. (2026, May 7). CoreWeave reports strong first quarter 2026 results. Retrieved from CoreWeave Investor Relations
- CoreWeave. (2026). Investor relations overview. Retrieved from CoreWeave Investor Relations Overview
- NVIDIA. (2026, January 26). NVIDIA and CoreWeave strengthen collaboration to accelerate buildout of AI factories. Retrieved from NVIDIA Newsroom
- Reuters. (2026, May 7). CoreWeave signals higher capex as component costs rise, shares fall.
- Reuters. (2026, May 13). Nvidia CEO’s foundation buys $108 million of AI computing from CoreWeave, donates it to researchers.
- Barron’s. (2026, June 2). CoreWeave is first to offer NVIDIA’s newest AI system. The stock rises.
- Yahoo Finance. (2026). CoreWeave, Inc. (CRWV) stock price, news, quote & history. Retrieved from Yahoo Finance CRWV Page
- Stock Analysis. (2026). CoreWeave (CRWV) stock price & overview. Retrieved from Stock Analysis CRWV Overview
- MarketWatch. (2026, May 7). CoreWeave shares plunge. Revenue doubles but AI costs are rising.