General Mills ($GIS): High Dividend Yield and Value Potential Draw Investor Attention

GIS, one of the most recognizable consumer staples companies in the United States, has increasingly attracted income-focused investors as its stock price has declined significantly from recent highs. Known for household brands such as Cheerios, Pillsbury, Häagen-Dazs, Betty Crocker, and Blue Buffalo, General Mills now offers one of the highest dividend yields in the packaged food sector.

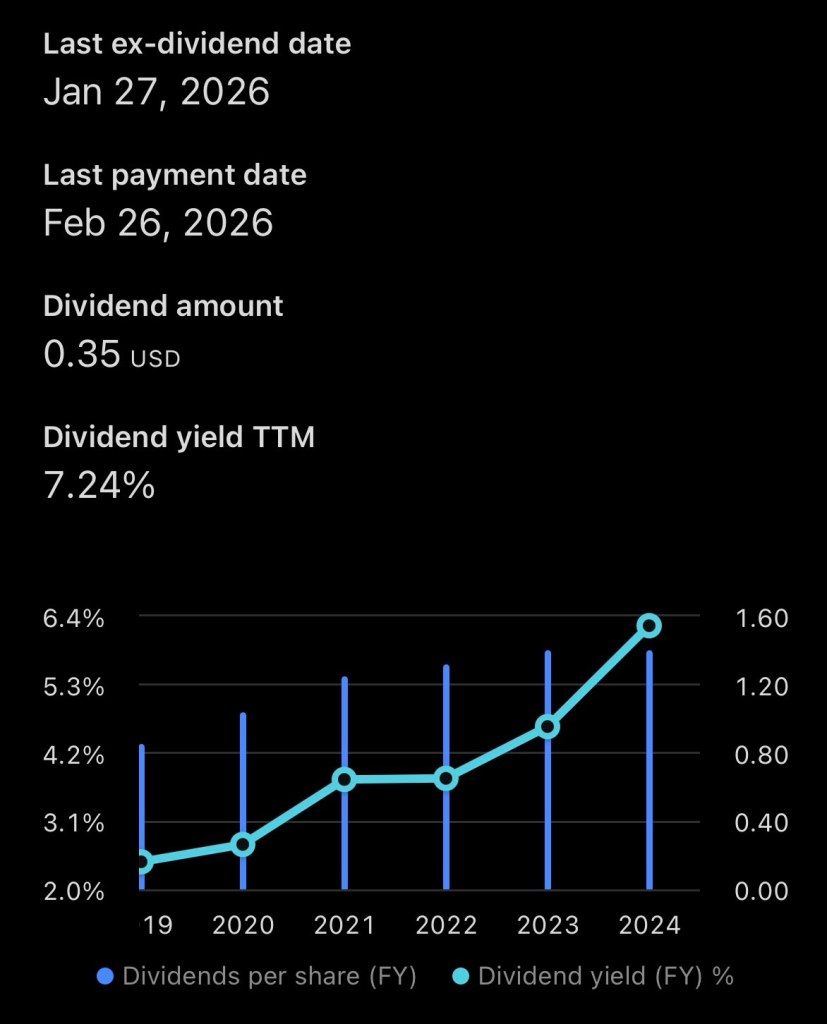
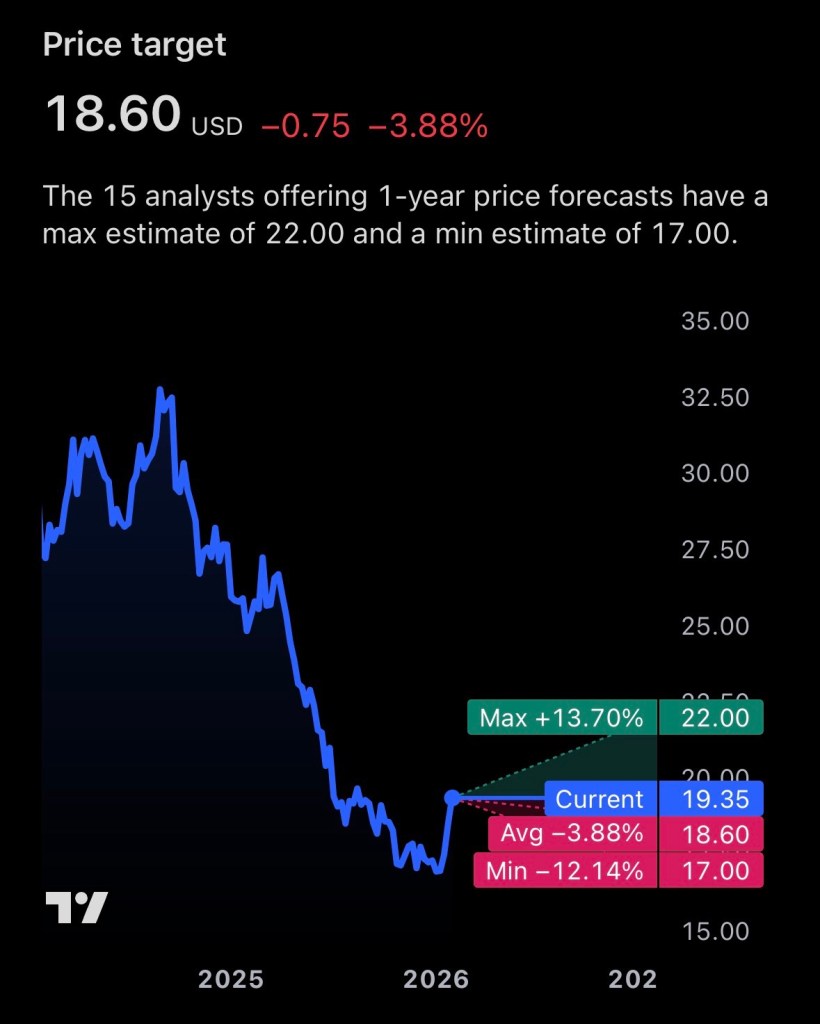
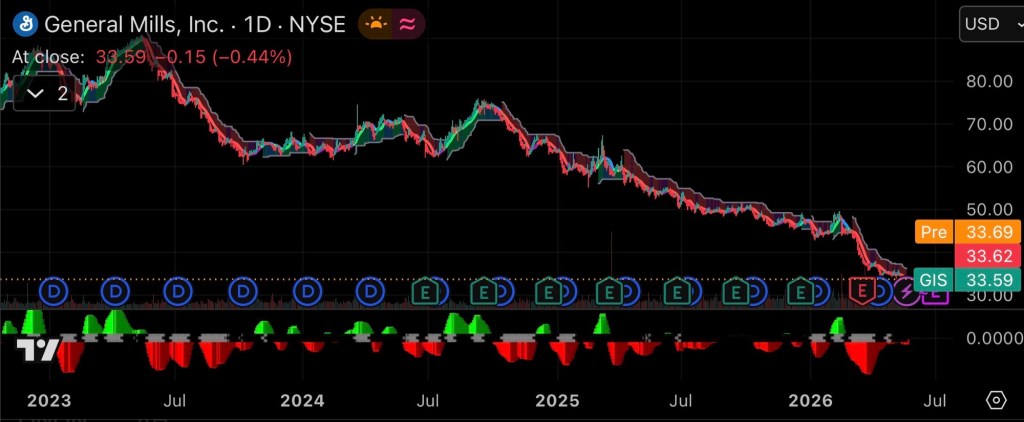
As of May 2026, shares of General Mills are trading near multi-year lows around the mid-$30 range after previously trading above $55 within the past year. The decline has pushed the company’s dividend yield above 7%, a level rarely seen for a mature consumer staples company with decades of dividend history.

Line and bar chart depicting financial growth trends from January to December
A vibrant chart showing fluctuating financial growth trends over a year

Strong Dividend Remains a Key Attraction

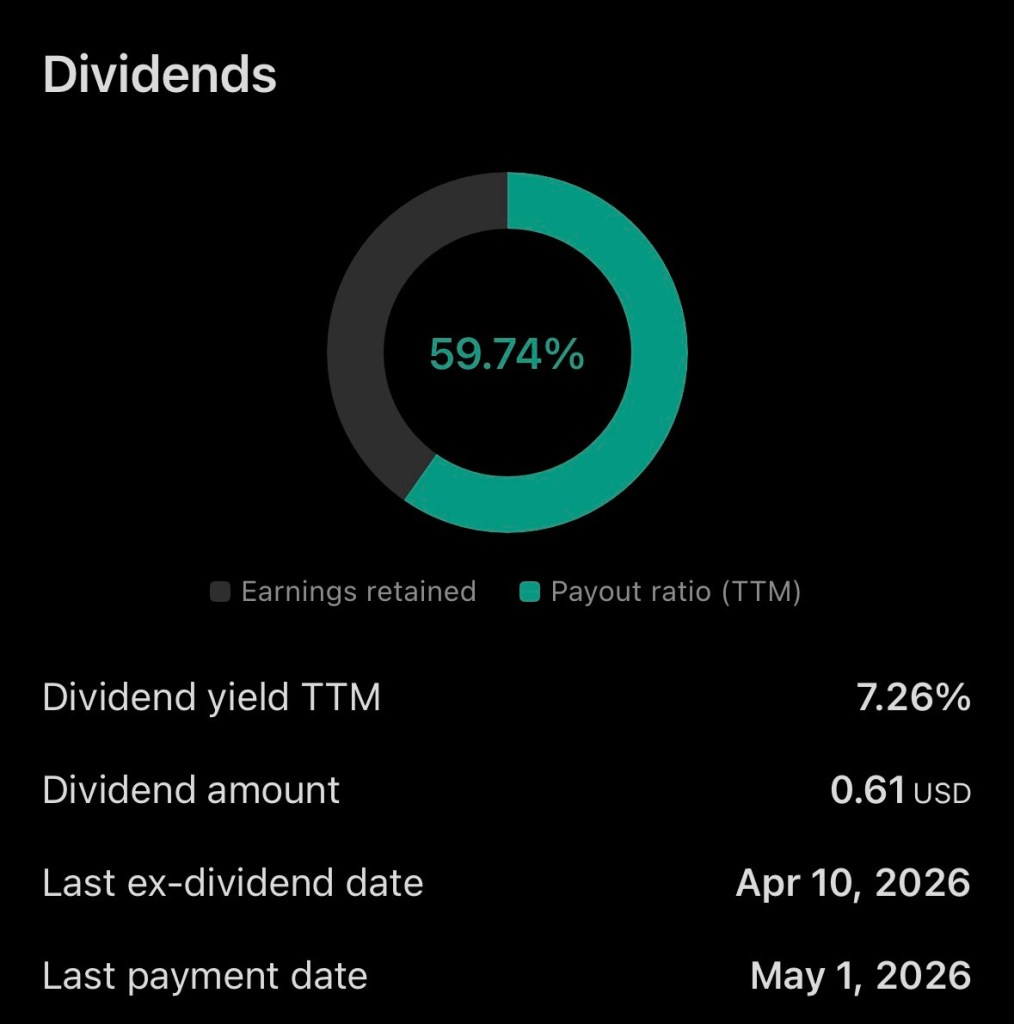
General Mills currently pays an annual dividend of approximately $2.44 per share, translating to a dividend yield above 7%. The company has maintained consistent quarterly dividend payments and has modestly increased its payout in recent years. The payout ratio remains near 60%, which many analysts still consider manageable for a stable consumer products company.

For income investors, the yield alone may make GIS an attractive defensive holding during periods of market volatility and economic uncertainty. Consumer staples companies historically perform better during slower economic periods because consumers continue purchasing essential food products regardless of broader market conditions.

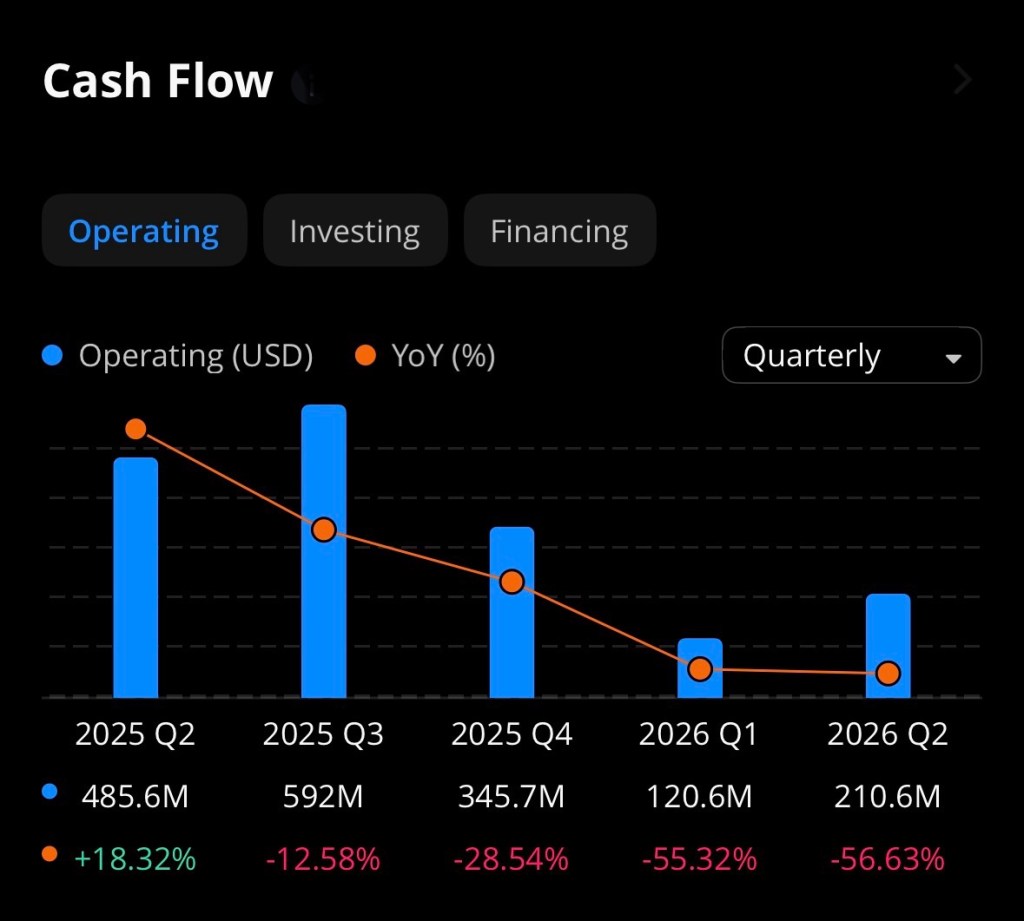
Financial Performance Shows Both Strengths and Challenges

While the dividend remains attractive, General Mills has faced operational headwinds over the past year. Revenue has declined modestly, with trailing twelve-month revenue around $18.4 billion, down more than 6% year-over-year. Earnings and profit margins have also softened as consumers increasingly seek lower-cost alternatives amid inflationary pressures.

The company recently reduced portions of its fiscal 2026 guidance, citing weaker consumer demand and increasing competition from private-label food brands. Management has acknowledged that shoppers are becoming increasingly price sensitive and are prioritizing value-based purchases.

Despite these challenges, General Mills continues to generate substantial cash flow and maintains strong brand recognition across multiple product categories. The company is also investing heavily in innovation, protein-focused products, pet food expansion, and operational efficiencies aimed at improving long-term growth.

Why Some Investors See Upside Potential

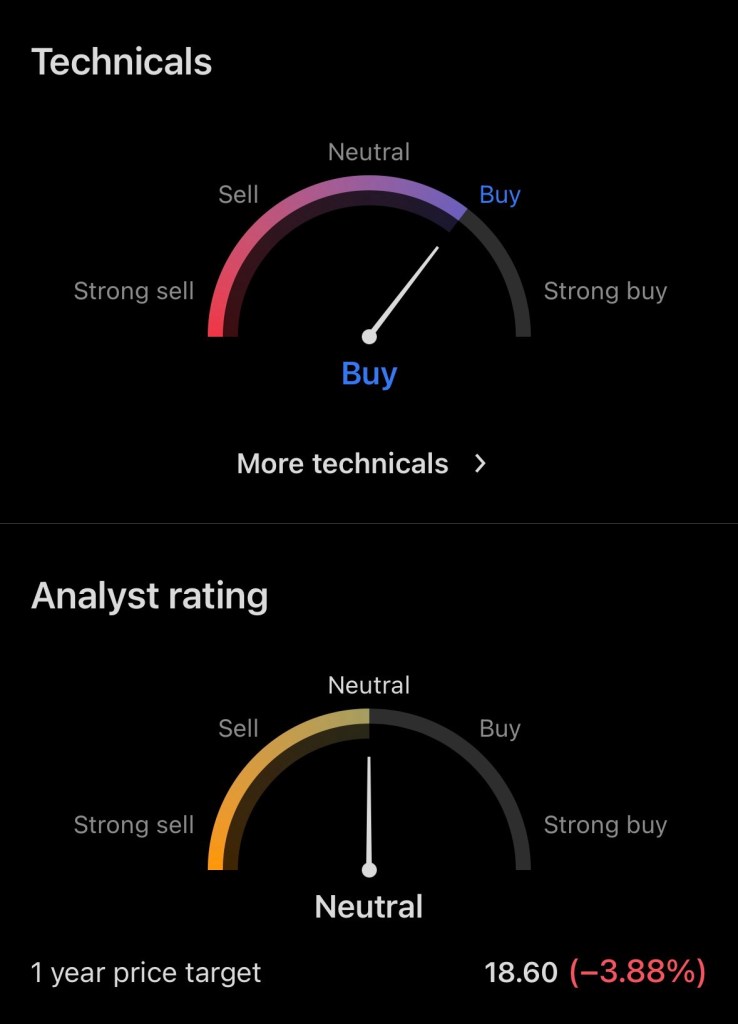
Although sentiment surrounding GIS has weakened, several valuation metrics suggest the stock could offer upside potential at current levels.

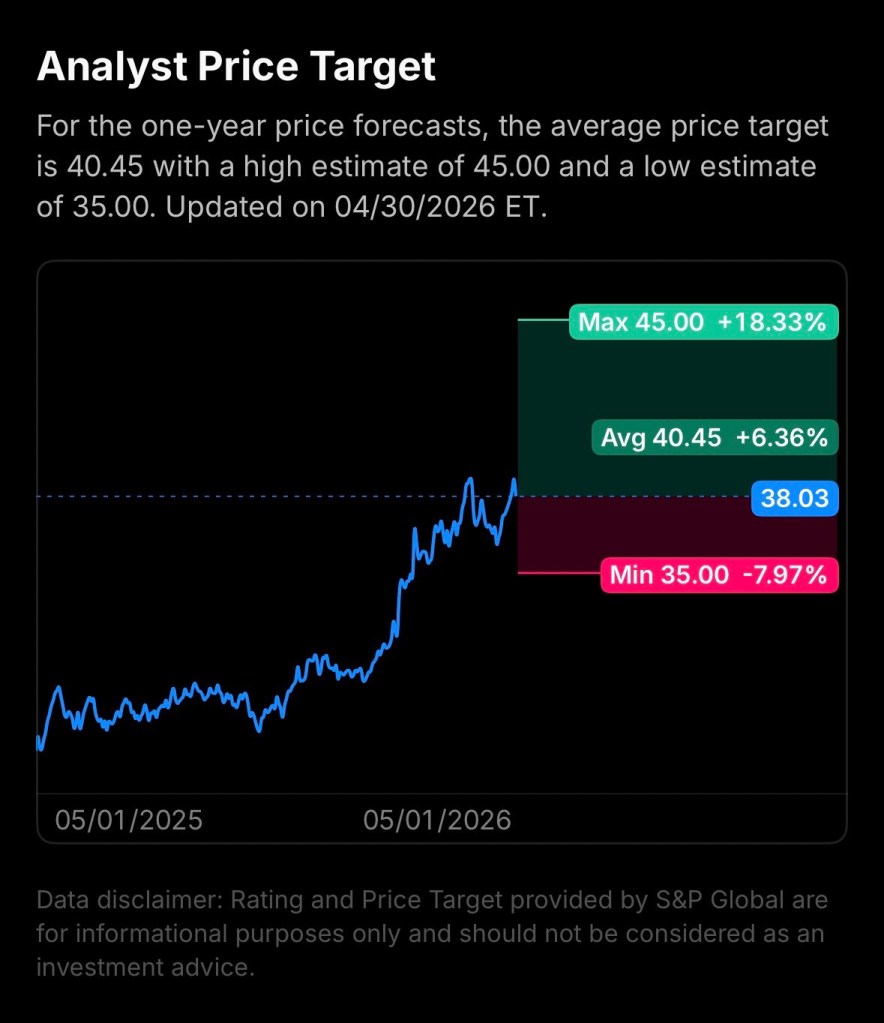
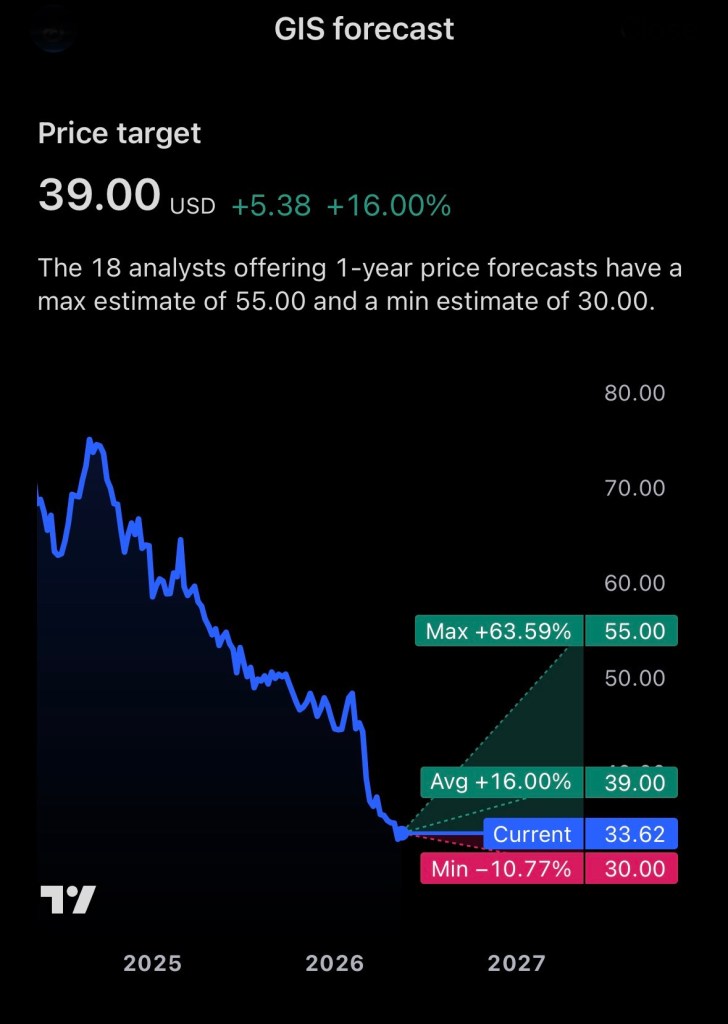
General Mills currently trades at a price-to-earnings ratio below 9, substantially lower than many competitors in the consumer staples sector. Analyst price targets average around $42 per share, implying potential upside of nearly 18% from recent trading levels.

Bullish investors argue that much of the negative outlook may already be reflected in the current stock price. If inflation moderates, consumer spending stabilizes, and management successfully executes its growth initiatives, GIS could potentially see both earnings stabilization and multiple expansion over the next 12 to 24 months.

Additionally, the combination of a high dividend yield and possible capital appreciation may appeal to long-term dividend growth investors seeking total return opportunities.

Risks Investors Should Monitor

Despite the attractive valuation and dividend yield, risks remain. Persistent inflation, changing consumer habits, private-label competition, and margin compression could continue pressuring earnings. The packaged food industry also faces ongoing challenges from shifting dietary preferences and increased competition from health-focused brands.

Investors should also monitor debt levels, input cost inflation, and whether the company can successfully restore organic sales growth over upcoming quarters.

Final Thoughts

General Mills appears to represent a classic value-versus-growth debate. The company is no longer viewed as a high-growth stock, but its depressed valuation, established global brands, and substantial dividend yield could present an opportunity for patient investors willing to accept slower growth and near-term volatility.

For dividend-focused portfolios, GIS may warrant consideration as a high-income consumer staples holding, particularly if management can stabilize sales trends and maintain strong free cash flow generation.

Disclosure

The author currently owns a position in General Mills ($GIS). This article is for informational purposes only and should not be considered financial advice. Investors should conduct their own research before making investment decisions.

References (APA Format)

MacroTrends. (2026). General Mills revenue 2012–2026. Retrieved May 21, 2026, from MacroTrends

Reuters. (2026, February 17). General Mills’ forecast cut from demand hit rattles packaged-food stocks. Retrieved May 21, 2026, from Reuters

Stock Analysis. (2026). General Mills (GIS) dividend history, dates & yield. Retrieved May 21, 2026, from Stock Analysis Dividend Page

Stock Analysis. (2026). General Mills (GIS) financials & income statement. Retrieved May 21, 2026, from Stock Analysis Financials

Stock Analysis. (2026). General Mills (GIS) stock price & overview. Retrieved May 21, 2026, from Stock Analysis Overview

MarketWatch. (2026). Cheerios parent General Mills says it will sacrifice some profit to drive sales amid cautious consumers. Retrieved May 21, 2026, from MarketWatch Article

Enterprise Products Partners (EPD): High-Yield Stability Meets Measured Growth in 2026

Enterprise Products Partners L.P. (NYSE: EPD), one of the largest midstream energy operators in North America, continues to attract income-focused investors in 2026 with a combination of steady cash flows, a strong dividend track record, and modest but reliable growth prospects.

Power plant with cooling towers and electrical substation with transmission lines at sunset
A power plant surrounded by transmission towers during a vibrant sunset

Stock Performance and Current Price

As of late April 2026, EPD shares are trading in the mid-to-high $30 range (approximately $36–$38 per unit), slightly below analyst consensus targets near $39.50.

The stock has demonstrated resilience this year, gaining over 20% year-to-date amid improving fundamentals and renewed investor interest in energy infrastructure assets.

Despite some short-term volatility and minor earnings misses, the broader trend remains constructive, supported by stable demand for oil, natural gas liquids (NGLs), and export services.

Dividend Profile: A Core Income Play

Enterprise Products Partners remains a standout in the income investing space:

  • Annual distribution: ~$2.20 per unit
  • Quarterly payout: $0.55
  • Dividend yield: ~5.8%–6.0%
  • Dividend growth streak: 28 consecutive years

The company recently reaffirmed its quarterly distribution for 2026, reflecting a ~2–3% year-over-year increase, consistent with its conservative capital return strategy.

Unlike high-growth equities, EPD prioritizes distribution stability and coverage, maintaining payout ratios supported by strong operating cash flow.

Financial Strength and Operational Momentum

Recent earnings and operational data highlight steady performance:

  • Q1 2026 EBITDA: ~$2.7 billion
  • Operating income growth: +8%
  • Revenue beat expectations despite EPS miss

Enterprise’s diversified asset base spanning pipelines, storage, processing, and export terminals continues to generate predictable fee-based income, insulating the business from commodity price volatility.

Growth Outlook: Moderate in 2026, Stronger Beyond

Looking ahead, analysts expect measured growth in 2026, with stronger acceleration into 2027:

  • 2026 outlook: Transitional year with stable cash flow
  • 2027+: Potential double-digit EBITDA and cash flow growth as new projects come online
  • Capital projects pipeline: ~$6 billion in infrastructure investments

Wall Street forecasts also indicate gradual earnings expansion:

  • 2026 estimated earnings: ~$6.1B
  • 2027 estimated earnings: ~$6.8B

This positions EPD as a “slow compounder” rather than a high-growth equity ideal for long-term income portfolios.

Key Investment Highlights

MetricValue / Insight
Current Stock Price~$36–$38
Dividend Yield~5.8%–6.0%
Annual Distribution~$2.20
Dividend Growth Streak28 years
2026 Stock Performance~+20% YTD
EBITDA (Q1 2026)~$2.7B
Growth OutlookModerate 2026, stronger 2027+
Analyst Target~$39.50

Investment Thesis

Enterprise Products Partners continues to deliver on its core value proposition: reliable income with low volatility and gradual capital appreciation.

Bull Case:

  • Durable, fee-based midstream business model
  • Strong balance sheet and distribution coverage
  • High yield relative to broader equity markets
  • Visible long-term growth pipeline

Bear Case:

  • Limited near-term upside due to mature asset base
  • Slower dividend growth compared to peers
  • Sensitivity to energy demand cycles and interest rates

Bottom Line

For 2026, Enterprise Products Partners is best viewed as a defensive income vehicle rather than a growth stock. Investors seeking consistent yield and stability in uncertain markets may find EPD particularly attractive, while those pursuing aggressive capital gains may look elsewhere.

With a near-6% yield, a decades-long dividend track record, and improving long-term growth catalysts, EPD remains a cornerstone holding in the midstream energy sector.

Disclosure Statement

Disclosure: The author currently holds a position in Enterprise Products Partners L.P. (NYSE: EPD). This article is for informational purposes only and should not be considered financial advice. Investors should conduct their own due diligence or consult a licensed financial professional before making investment decisions.


References (APA Format)

Yahoo Finance. (2026). Enterprise Products Partners L.P. (EPD) stock price, news, and analysis. Retrieved May 2, 2026, from https://finance.yahoo.com/

MarketBeat. (2026). Enterprise Products Partners dividend history and yield. Retrieved May 2, 2026, from https://www.marketbeat.com/

Simply Wall St. (2026). Enterprise Products Partners distribution updates and analysis. Retrieved May 2, 2026, from https://simplywall.st/

Intellectia. (2026). Enterprise Products Partners starts 2026 strong with stock gains. Retrieved May 2, 2026, from https://intellectia.ai/

The Motley Fool. (2026). Energy dividend stocks outlook and analysis. Retrieved May 2, 2026, from https://www.fool.com/

Seeking Alpha. (2026). Enterprise Products Partners: Growth outlook and capital projects. Retrieved May 2, 2026, from https://seekingalpha.com/

WallStreetZen. (2026). EPD stock forecast and earnings projections. Retrieved May 2, 2026, from https://www.wallstreetzen.com/

Conagra Brands ($CAG): High Dividend Yield and Depressed Valuation Create a Compelling Income Opportunity

February 7, 2026

Conagra Brands, Inc. (NYSE: CAG), one of America’s largest packaged food companies and owner of iconic brands such as Birds Eye, Slim Jim, Healthy Choice, and Marie Callender’s, has emerged as a compelling investment candidate for income-focused investors. Despite recent operational challenges and declining share price performance, the company’s unusually high dividend yield, stable cash flows, and historically low valuation may present an attractive risk-reward profile for long-term investors willing to tolerate near-term volatility.


Current Stock Price and Market Position

As of early February 2026, Conagra Brands shares are trading at approximately $19.55 per share, near the lower end of their 52-week range of $15.96 to $28.52. The company currently carries a market capitalization of roughly $8.8–$8.9 billion and generates annual revenue of approximately $11.23 billion, underscoring its significant presence in the consumer staples sector.

However, the stock has declined more than 26% over the past year, reflecting investor concerns about declining sales volume, rising costs, and shifting consumer preferences.

While these headwinds have weighed on investor sentiment, they have also created a rare combination of depressed valuation and elevated income potential.


Dividend Yield: A Major Strength for Income Investors

Conagra Brands’ most compelling investment characteristic is its dividend.

  • Annual dividend: $1.40 per share
  • Dividend yield: Approximately 7.16% to 7.89% depending on price fluctuations
  • Dividend payout frequency: Quarterly
  • Dividend history: Over 160 dividend payments since 1985

This yield is significantly higher than the broader S&P 500 average, which typically ranges between 1.5% and 2.0%.

Even more importantly, Conagra generates strong free cash flow—approximately $1.14 billion annually—which supports its dividend payments and enhances their sustainability.

The company’s dividend payout ratio based on forward estimates ranges between 45% and 59% of cash flow, indicating the dividend is supported by underlying earnings power rather than excessive borrowing.

For investors seeking income, this dividend alone provides substantial annual returns regardless of stock price appreciation.


Valuation: Historically Low Price Creates Opportunity

One of the most compelling reasons investors may consider Conagra today is its relatively low valuation.

Key valuation metrics include:

  • Forward price-to-earnings ratio: Approximately 10.4
  • Free cash flow yield: 13.4%
  • Book value per share: $18.64 (close to current share price)

These metrics suggest the stock is trading near its intrinsic asset value, with investors effectively paying a modest premium for a business that generates over $1 billion annually in free cash flow.

Historically, consumer staples companies trade at higher multiples due to their predictable cash flows and defensive characteristics. A forward P/E ratio near 10 places Conagra at a meaningful discount compared to many peers.


Cash Flow and Financial Strength Support Long-Term Stability

Despite near-term earnings pressures, Conagra remains fundamentally profitable and cash-generating.

Financial highlights include:

  • Operating cash flow: $1.54 billion annually
  • Free cash flow: $1.14 billion annually
  • Gross margin: 25.5%
  • Operating margin: 13.83%

These metrics demonstrate that even in a challenging economic environment, Conagra continues to generate meaningful profit margins.

Consumer staples companies like Conagra also tend to be more resilient during economic downturns, as demand for packaged food remains relatively stable regardless of broader economic conditions.


Recent Challenges Have Created Opportunity

Recent operational challenges have contributed to the stock’s decline, including:

  • Volume declines due to inflation-sensitive consumers
  • Rising raw material costs, particularly meat prices
  • Impairment charges and slower growth expectations

However, these challenges appear cyclical rather than structural.

Importantly, Conagra has reaffirmed its long-term outlook and continues investing in efficiency improvements, pricing strategies, and portfolio optimization.


Analyst Price Target and Future Outlook

Wall Street analysts currently maintain an average price target of approximately $20.58, representing potential upside of about 16% from current levels.

Even more conservative targets suggest modest appreciation potential, while income investors collect a substantial dividend while waiting.

Reasonable 12-Month Price Projection

Based on:

  • Historical valuation multiples
  • Dividend yield normalization
  • Improving cost pressures
  • Stable consumer demand

A realistic one-year price range for Conagra Brands is:

Base Case: $20–$23
Bull Case: $24–$26
Bear Case: $17–$19

In addition to capital appreciation, investors could receive approximately 7% annual income, significantly enhancing total returns.


Total Return Potential: Combining Dividend and Price Recovery

If shares rise from $19.55 to $22.50 over the next year:

  • Capital gain: ~15%
  • Dividend yield: ~7%
  • Total return potential: ~22%

This level of total return potential is unusually high for a defensive consumer staples company.


Why Conagra Brands May Be a Strong Investment Choice

Key investment strengths include:

1. Exceptionally High Dividend Yield
Nearly 7–8%, far above market averages.

2. Strong Cash Flow Generation
Over $1 billion annually supports dividend sustainability.

3. Low Valuation Relative to Cash Flow and Assets
Forward P/E near 10 suggests undervaluation.

4. Defensive Industry Position
Food companies benefit from consistent consumer demand.

5. Potential Price Recovery as Conditions Improve
Even modest improvement could drive meaningful upside.


Investment Risks

Despite its strengths, investors should consider potential risks:

  • High debt levels (~$8.28 billion)
  • Slowing revenue growth
  • Inflation and commodity cost pressures
  • Changing consumer dietary preferences

These risks explain the stock’s depressed valuation but also contribute to its opportunity.


Conclusion: Attractive Income Play with Recovery Potential

Conagra Brands represents a classic high-yield, undervalued income stock. While recent operational challenges have pushed shares lower, the company continues generating strong cash flow and paying a highly attractive dividend.

For income-focused investors and those seeking undervalued defensive stocks, Conagra offers:

  • Strong income potential
  • Possible capital appreciation
  • Defensive consumer staples exposure

If operational performance stabilizes and investor sentiment improves, Conagra Brands could deliver both income and moderate capital gains over the coming year.


Disclosure

The author currently holds a position in Conagra Brands (CAG). This article is for informational purposes only and should not be considered financial advice. Investors should conduct their own research or consult a financial advisor before making investment decisions.


References

StockAnalysis.com. (2026). Conagra Brands stock statistics and valuation. Retrieved from https://stockanalysis.com/stocks/cag/statistics/

StockAnalysis.com. (2026). Conagra Brands dividend information. Retrieved from https://stockanalysis.com/stocks/cag/dividend/

StockAnalysis.com. (2026). Conagra Brands stock overview. Retrieved from https://stockanalysis.com/stocks/cag/

CompaniesMarketCap.com. (2026). Conagra Brands dividend yield and market cap. Retrieved from https://companiesmarketcap.com/conagra-brands/dividend-yield/

CompaniesMarketCap.com. (2026). Conagra Brands dividend history. Retrieved from https://companiesmarketcap.com/conagra-brands/dividends/

MarketBeat.com. (2026). Conagra Brands dividend payout ratio and yield analysis. Retrieved from https://www.marketbeat.com

Reuters. (2025). Conagra maintains forecasts amid subdued demand. Retrieved from https://www.reuters.com

Barron’s. (2025). Conagra downgraded due to rising meat prices. Retrieved from https://www.barrons.com