Bonds Are Back: From Portfolio Stabilizer to Income and Opportunity Engine

For much of the past decade, bonds were viewed primarily as a defensive allocation useful for dampening volatility, but rarely exciting. With historically low yields following the Global Financial Crisis and through the pandemic era, investors increasingly turned toward equities for meaningful returns while bonds played a passive role as a stabilizer.

That narrative is now changing. Bonds are once again emerging not only as a ballast for portfolios but as a legitimate source of income, total return potential, and tactical opportunity particularly for investors who understand how to position themselves across the yield curve.

The Great Reset: Higher Yields Have Changed the Equation

The most important development driving renewed interest in bonds is simple: yields are materially higher than they were just a few years ago.

Following aggressive Federal Reserve rate hikes between 2022 and 2024 to combat inflation, interest rates across maturities reset to levels not seen in over 15 years. As a result:

  • Short-term U.S. Treasury yields have hovered between 4.0% and 5.0%
  • Intermediate-term Treasuries offer yields in the 3.8% to 4.5% range
  • Investment-grade corporate bonds often yield 4.5% to 6.0%
  • Select high-quality municipal bonds provide tax-equivalent yields exceeding 6% for high-income investors

This shift represents a structural change. Investors can now generate meaningful income from bonds without assuming excessive credit risk or volatility.

For retirees, income-focused investors, and balanced portfolio managers, this is a significant opportunity.

Understanding the Yield Curve: Opportunity Lies in Positioning

The yield curve which plots interest rates across different maturities has been unusually dynamic in recent years. In some periods, shorter-term bonds have yielded more than longer-term bonds, creating what is known as an inverted yield curve, often associated with economic transitions.

This environment creates multiple strategic options.

Short-Term Bonds: High Income, Low Duration Risk

Short-term bonds (1–3 years maturity) currently offer attractive yields with minimal sensitivity to interest rate changes. This makes them ideal for:

  • Conservative investors
  • Cash alternatives
  • Capital preservation with income

They provide flexibility, allowing investors to reinvest at higher rates if yields rise further.

Intermediate-Term Bonds: The “Sweet Spot”

Many professional portfolio managers consider the intermediate portion of the yield curve (3–7 years) to offer the best balance of income and risk.

These bonds:

  • Provide strong yields
  • Offer moderate duration exposure
  • Stand to benefit if interest rates decline in the future

If rates fall, intermediate bonds may appreciate in price, delivering both income and capital gains.

Long-Term Bonds: Strategic Opportunity for Rate Declines

Long-duration bonds (10+ years) are more sensitive to interest rate movements but offer significant upside potential if interest rates decline.

When rates fall:

  • Bond prices rise
  • Longer-duration bonds rise more dramatically

This creates potential total return opportunities beyond income alone.

Bonds Are Once Again Competing with Stocks

One of the most important implications of higher yields is that bonds are now competitive with equities from an income perspective.

Consider this comparison:

  • S&P 500 dividend yield: approximately 1.5%
  • Investment-grade bonds: 4.5% to 6.0% yield
  • Treasury bonds: 3.8% to 4.5% yield

For the first time in many years, bonds offer substantially higher income with lower volatility.

This improves the risk-return tradeoff of balanced portfolios.

Portfolio Implications: A Strategic Shift Back Toward Fixed Income

Financial professionals increasingly recommend a renewed allocation to bonds—not just for safety, but for income generation and opportunity capture.

Thoughtful positioning across maturities can provide three simultaneous benefits:

1. Reliable Income Stream

Higher yields allow investors to generate consistent income without relying solely on dividends or equity appreciation.

2. Capital Appreciation Potential

If interest rates decline in the next 12–36 months, as many economists expect bond prices may rise, providing total return potential.

3. Risk Diversification

Bonds help reduce portfolio volatility and provide protection during equity market downturns.

Recommended Portfolio Framework: Laddered and Diversified

Rather than concentrating exposure in a single maturity, many advisors recommend a laddered bond strategy, which distributes investments across multiple maturities.

A sample framework may include:

  • 30% Short-Term Bonds (1–3 years)
    Provides stability and reinvestment flexibility
  • 40% Intermediate-Term Bonds (3–7 years)
    Offers strong income and balanced rate sensitivity
  • 20% Long-Term Bonds (7–20 years)
    Positions portfolio for capital appreciation if rates decline
  • 10% Opportunistic Credit (Investment-grade corporates or municipals)
    Enhances yield without excessive risk

This structure balances income, stability, and growth potential.
The Role of Bonds in 2026 and Beyond

The bond market is no longer an afterthought. It has returned to its traditional role as both a defensive and offensive component of a well-constructed portfolio.

Investors who actively position across the yield curve can benefit from:

  • Elevated income levels
  • Potential capital gains from future rate declines
  • Improved diversification and portfolio stability

After years of offering limited returns, bonds are once again doing what they were always meant to do: generate income, preserve capital, and create opportunity.

For disciplined investors, this is not merely a defensive allocation… it is a strategic advantage.

References

Board of Governors of the Federal Reserve System. (2026). Selected interest rates (daily) – H.15 release. https://www.federalreserve.gov/releases/h15/

U.S. Department of the Treasury. (2026). Daily treasury yield curve rates. https://home.treasury.gov/resource-center/data-chart-center/interest-rates

Federal Reserve Bank of St. Louis. (2026). 10-year treasury constant maturity rate (DGS10). FRED Economic Data. https://fred.stlouisfed.org/series/DGS10

U.S. Securities and Exchange Commission. (2024). Investor bulletin: Bonds. https://www.sec.gov/resources-for-investors/investor-alerts-bulletins/investor-bulletin-bonds

Morningstar, Inc. (2026). Fixed-income outlook and bond market commentary. https://www.morningstar.com

S&P Dow Jones Indices. (2026). S&P 500 dividend yield and index characteristics. https://www.spglobal.com/spdji/en/indices/equity/sp-500/

Vanguard Group. (2026). Economic and market outlook: Fixed income perspectives. https://investor.vanguard.com/investment-products/fixed-income

BlackRock. (2026). Global fixed income outlook. https://www.blackrock.com/institutions/en-us/insights/fixed-income

Conagra Brands ($CAG): High Dividend Yield and Depressed Valuation Create a Compelling Income Opportunity

February 7, 2026

Conagra Brands, Inc. (NYSE: CAG), one of America’s largest packaged food companies and owner of iconic brands such as Birds Eye, Slim Jim, Healthy Choice, and Marie Callender’s, has emerged as a compelling investment candidate for income-focused investors. Despite recent operational challenges and declining share price performance, the company’s unusually high dividend yield, stable cash flows, and historically low valuation may present an attractive risk-reward profile for long-term investors willing to tolerate near-term volatility.


Current Stock Price and Market Position

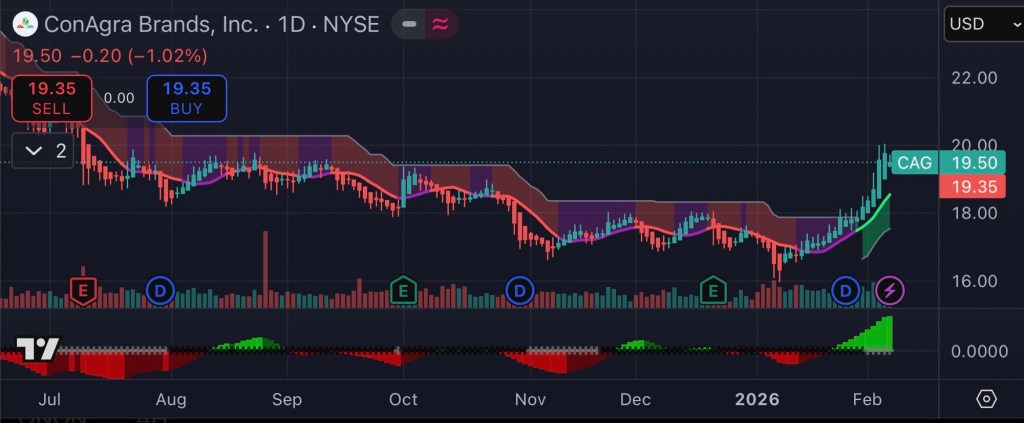
As of early February 2026, Conagra Brands shares are trading at approximately $19.55 per share, near the lower end of their 52-week range of $15.96 to $28.52. The company currently carries a market capitalization of roughly $8.8–$8.9 billion and generates annual revenue of approximately $11.23 billion, underscoring its significant presence in the consumer staples sector.

However, the stock has declined more than 26% over the past year, reflecting investor concerns about declining sales volume, rising costs, and shifting consumer preferences.

While these headwinds have weighed on investor sentiment, they have also created a rare combination of depressed valuation and elevated income potential.


Dividend Yield: A Major Strength for Income Investors

Conagra Brands’ most compelling investment characteristic is its dividend.

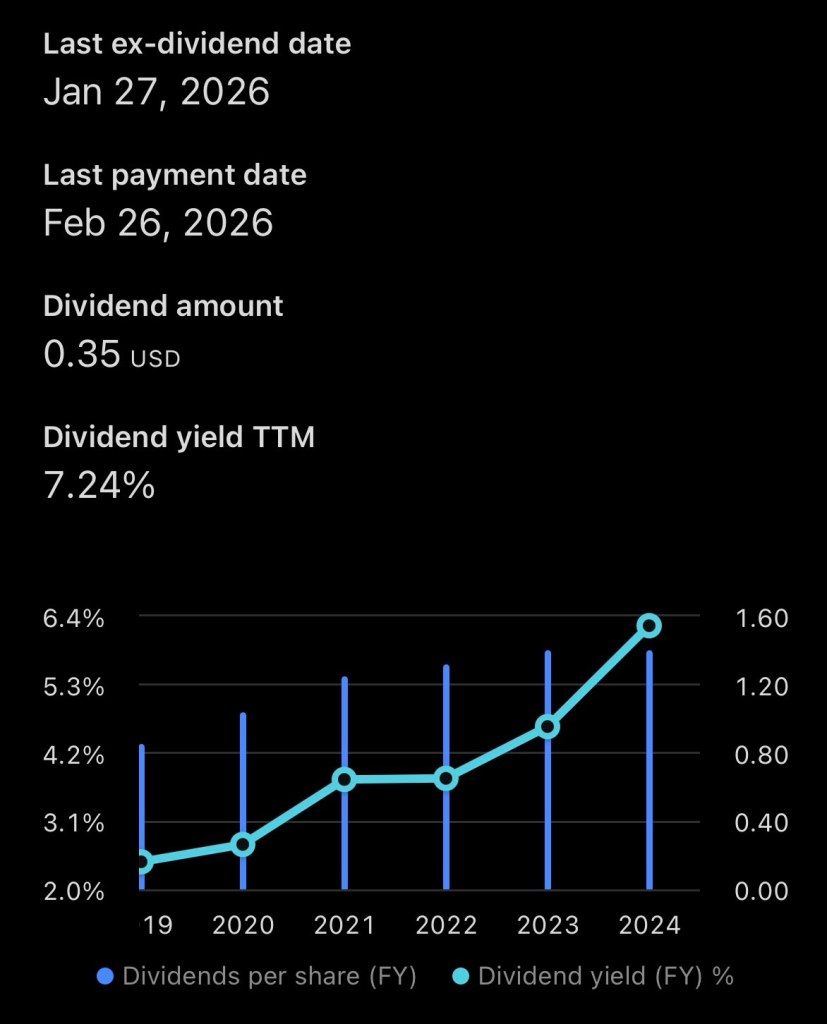
  • Annual dividend: $1.40 per share
  • Dividend yield: Approximately 7.16% to 7.89% depending on price fluctuations
  • Dividend payout frequency: Quarterly
  • Dividend history: Over 160 dividend payments since 1985

This yield is significantly higher than the broader S&P 500 average, which typically ranges between 1.5% and 2.0%.

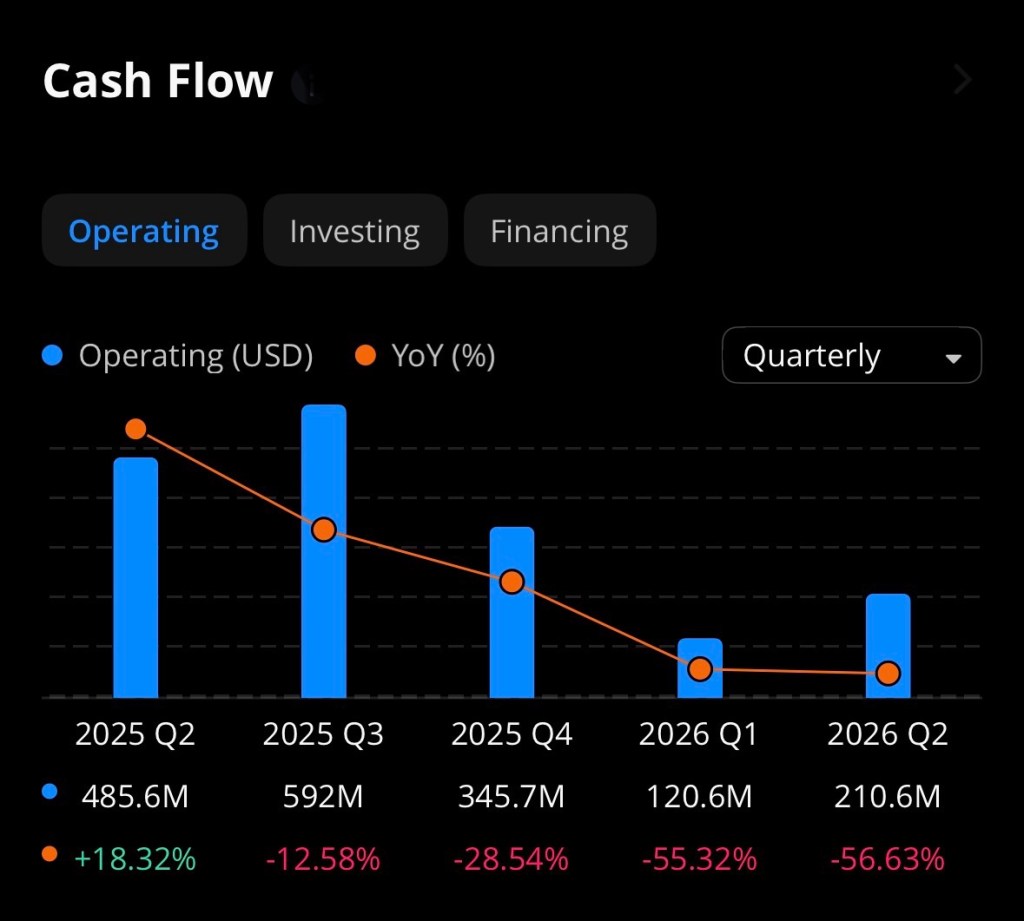
Even more importantly, Conagra generates strong free cash flow—approximately $1.14 billion annually—which supports its dividend payments and enhances their sustainability.

The company’s dividend payout ratio based on forward estimates ranges between 45% and 59% of cash flow, indicating the dividend is supported by underlying earnings power rather than excessive borrowing.

For investors seeking income, this dividend alone provides substantial annual returns regardless of stock price appreciation.


Valuation: Historically Low Price Creates Opportunity

One of the most compelling reasons investors may consider Conagra today is its relatively low valuation.

Key valuation metrics include:

  • Forward price-to-earnings ratio: Approximately 10.4
  • Free cash flow yield: 13.4%
  • Book value per share: $18.64 (close to current share price)

These metrics suggest the stock is trading near its intrinsic asset value, with investors effectively paying a modest premium for a business that generates over $1 billion annually in free cash flow.

Historically, consumer staples companies trade at higher multiples due to their predictable cash flows and defensive characteristics. A forward P/E ratio near 10 places Conagra at a meaningful discount compared to many peers.


Cash Flow and Financial Strength Support Long-Term Stability

Despite near-term earnings pressures, Conagra remains fundamentally profitable and cash-generating.

Financial highlights include:

  • Operating cash flow: $1.54 billion annually
  • Free cash flow: $1.14 billion annually
  • Gross margin: 25.5%
  • Operating margin: 13.83%

These metrics demonstrate that even in a challenging economic environment, Conagra continues to generate meaningful profit margins.

Consumer staples companies like Conagra also tend to be more resilient during economic downturns, as demand for packaged food remains relatively stable regardless of broader economic conditions.


Recent Challenges Have Created Opportunity

Recent operational challenges have contributed to the stock’s decline, including:

  • Volume declines due to inflation-sensitive consumers
  • Rising raw material costs, particularly meat prices
  • Impairment charges and slower growth expectations

However, these challenges appear cyclical rather than structural.

Importantly, Conagra has reaffirmed its long-term outlook and continues investing in efficiency improvements, pricing strategies, and portfolio optimization.


Analyst Price Target and Future Outlook

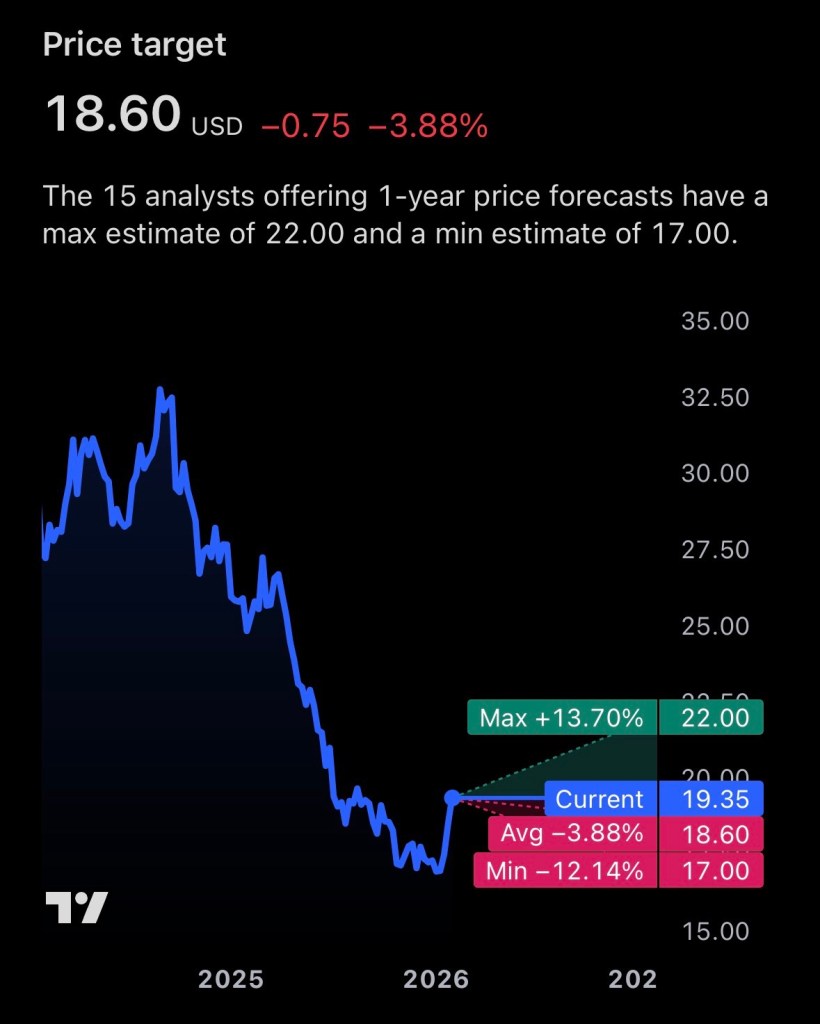
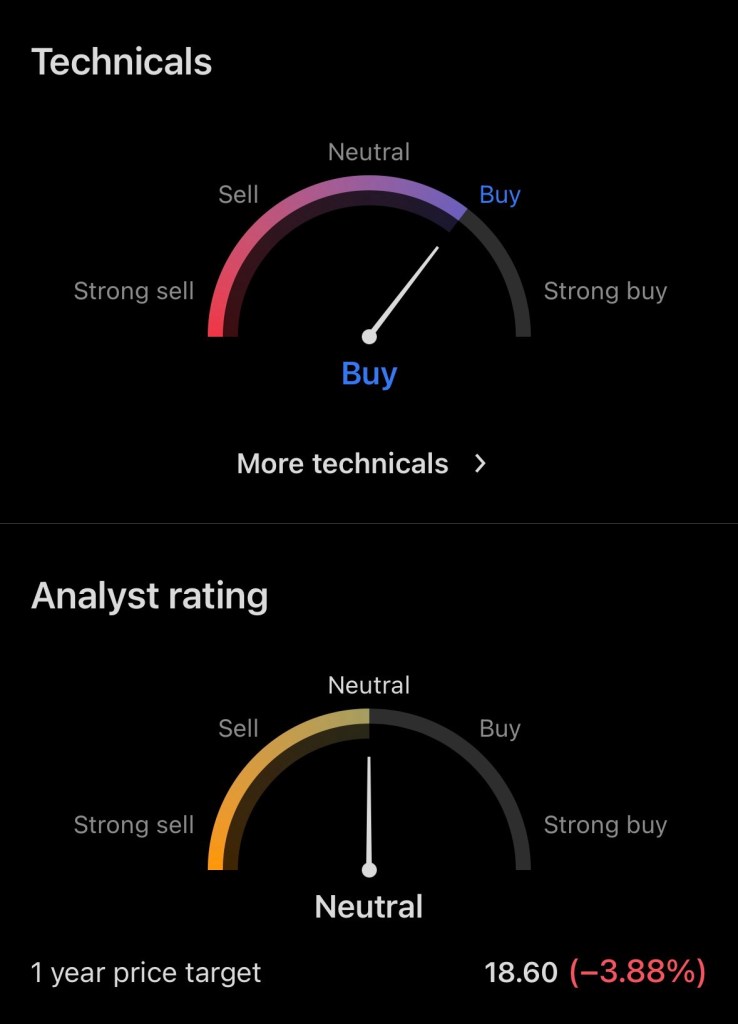
Wall Street analysts currently maintain an average price target of approximately $20.58, representing potential upside of about 16% from current levels.

Even more conservative targets suggest modest appreciation potential, while income investors collect a substantial dividend while waiting.

Reasonable 12-Month Price Projection

Based on:

  • Historical valuation multiples
  • Dividend yield normalization
  • Improving cost pressures
  • Stable consumer demand

A realistic one-year price range for Conagra Brands is:

Base Case: $20–$23
Bull Case: $24–$26
Bear Case: $17–$19

In addition to capital appreciation, investors could receive approximately 7% annual income, significantly enhancing total returns.


Total Return Potential: Combining Dividend and Price Recovery

If shares rise from $19.55 to $22.50 over the next year:

  • Capital gain: ~15%
  • Dividend yield: ~7%
  • Total return potential: ~22%

This level of total return potential is unusually high for a defensive consumer staples company.


Why Conagra Brands May Be a Strong Investment Choice

Key investment strengths include:

1. Exceptionally High Dividend Yield
Nearly 7–8%, far above market averages.

2. Strong Cash Flow Generation
Over $1 billion annually supports dividend sustainability.

3. Low Valuation Relative to Cash Flow and Assets
Forward P/E near 10 suggests undervaluation.

4. Defensive Industry Position
Food companies benefit from consistent consumer demand.

5. Potential Price Recovery as Conditions Improve
Even modest improvement could drive meaningful upside.


Investment Risks

Despite its strengths, investors should consider potential risks:

  • High debt levels (~$8.28 billion)
  • Slowing revenue growth
  • Inflation and commodity cost pressures
  • Changing consumer dietary preferences

These risks explain the stock’s depressed valuation but also contribute to its opportunity.


Conclusion: Attractive Income Play with Recovery Potential

Conagra Brands represents a classic high-yield, undervalued income stock. While recent operational challenges have pushed shares lower, the company continues generating strong cash flow and paying a highly attractive dividend.

For income-focused investors and those seeking undervalued defensive stocks, Conagra offers:

  • Strong income potential
  • Possible capital appreciation
  • Defensive consumer staples exposure

If operational performance stabilizes and investor sentiment improves, Conagra Brands could deliver both income and moderate capital gains over the coming year.


Disclosure

The author currently holds a position in Conagra Brands (CAG). This article is for informational purposes only and should not be considered financial advice. Investors should conduct their own research or consult a financial advisor before making investment decisions.


References

StockAnalysis.com. (2026). Conagra Brands stock statistics and valuation. Retrieved from https://stockanalysis.com/stocks/cag/statistics/

StockAnalysis.com. (2026). Conagra Brands dividend information. Retrieved from https://stockanalysis.com/stocks/cag/dividend/

StockAnalysis.com. (2026). Conagra Brands stock overview. Retrieved from https://stockanalysis.com/stocks/cag/

CompaniesMarketCap.com. (2026). Conagra Brands dividend yield and market cap. Retrieved from https://companiesmarketcap.com/conagra-brands/dividend-yield/

CompaniesMarketCap.com. (2026). Conagra Brands dividend history. Retrieved from https://companiesmarketcap.com/conagra-brands/dividends/

MarketBeat.com. (2026). Conagra Brands dividend payout ratio and yield analysis. Retrieved from https://www.marketbeat.com

Reuters. (2025). Conagra maintains forecasts amid subdued demand. Retrieved from https://www.reuters.com

Barron’s. (2025). Conagra downgraded due to rising meat prices. Retrieved from https://www.barrons.com

ServiceNow Navigates Market Volatility With Strong Fundamentals and AI Momentum

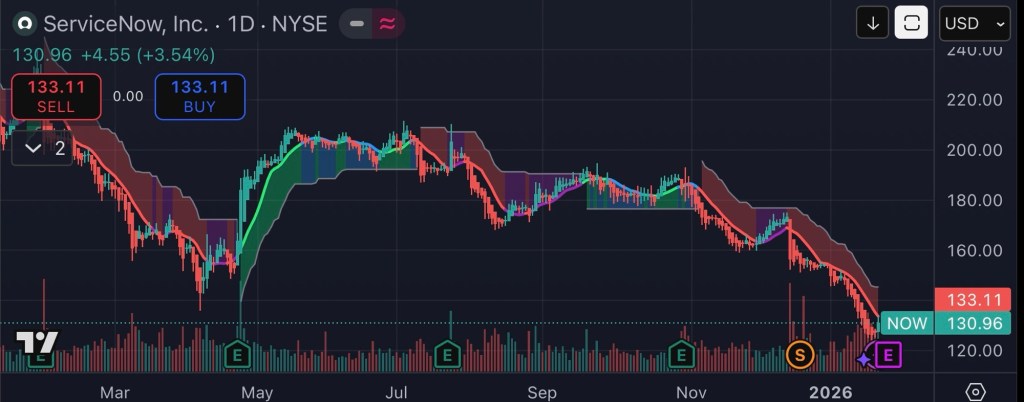
ServiceNow, Inc. (NYSE: NOW), the enterprise workflow automation and AI-driven software company, is attracting renewed investor attention as it enters its next earnings period with mixed signals from the market. After a prolonged sell-off in 2025 and early 2026, shares have shown signs of stabilization ahead of quarterly results due this week, while analysts revise forecasts on both the upside and downside.

Market Context:
As of the most recent close, ServiceNow’s stock price finished at $133.11, up 3.5% on positive sentiment ahead of earnings week. (TechStock²) The company’s shares have experienced significant pressure over the past year, falling roughly 30–50 percent from prior highs, signaling broader investor caution within the enterprise software sector. (TradingView+1)


Recent Financial Performance

ServiceNow’s underlying financial performance remains robust despite stock price challenges:

MetricMost Recent Reported
Q3 2025 Revenue$3.407 billion (+22% YoY) (GuruFocus)
Subscription Revenue$3.299 billion (+21.5% YoY) (GuruFocus)
Q3 2025 EPS$2.40 (beats expectations) (GuruFocus)
Q2 2025 Subscription Revenue$3.113 billion (+22.5% YoY) (ServiceNow Investor Relations)
Performance Obligations (RPO)$23.9 billion (+29% YoY) (ServiceNow Investor Relations)

ServiceNow also continues to expand its customer base, with strong demand in large enterprises and sustained growth in contract value obligations. (ServiceNow Investor Relations)

Financial Chart (Selected Historical & Forecast Data):

Metric / Timeframe2024 Actual2025 ActualAnalyst 2026 Avg Target
Revenue Growth~21% YoY~22% YoY— (Estimated Stable Growth)
Stock Price (Year-End)~$239.62 (52-wk high) (MarketWatch)~$128–134 range (MarketWatch)Consensus ~ $209.07 Avg (MarketBeat)
Analyst Price Target Range$170–$263 (TipRanks)Consensus Moderate Buy$209.07 Average 12-mo (MarketBeat)

Catalysts and Risks

Positive Drivers:

  • AI Integration and Partnerships: The company’s strategic deployment of AI capabilities particularly through deepening enterprise AI products and partnerships positions it within one of the fastest-growing segments of enterprise software. (The Wall Street Journal)
  • Earnings Beats: Recent quarters have seen revenue and EPS exceed consensus estimates, reinforcing the company’s pricing power and durability even in more cautious macro environments. (Nasdaq)
  • Stock Split Authorization: A board-approved 5-for-1 stock split aims to improve liquidity and broaden retail investor ownership. (Yahoo Finance)

Challenges:

  • Valuation Compression: Analysts have trimmed price targets in light of broader software sector rotation, leading to downward revisions that reflect caution ahead of earnings and uncertain macro conditions. (Ad Hoc News)
  • Market Sentiment: Software stocks broadly have underperformed amid shifting investor preferences toward semiconductors and AI infrastructure names, contributing to valuation pressure for ServiceNow. (Investopedia)

Analyst Forward Outlook & Stock Price Forecast (Next 12 Months)

Market forecasts reflect a moderate buy consensus for NOW with meaningful upside potential despite short-term volatility:

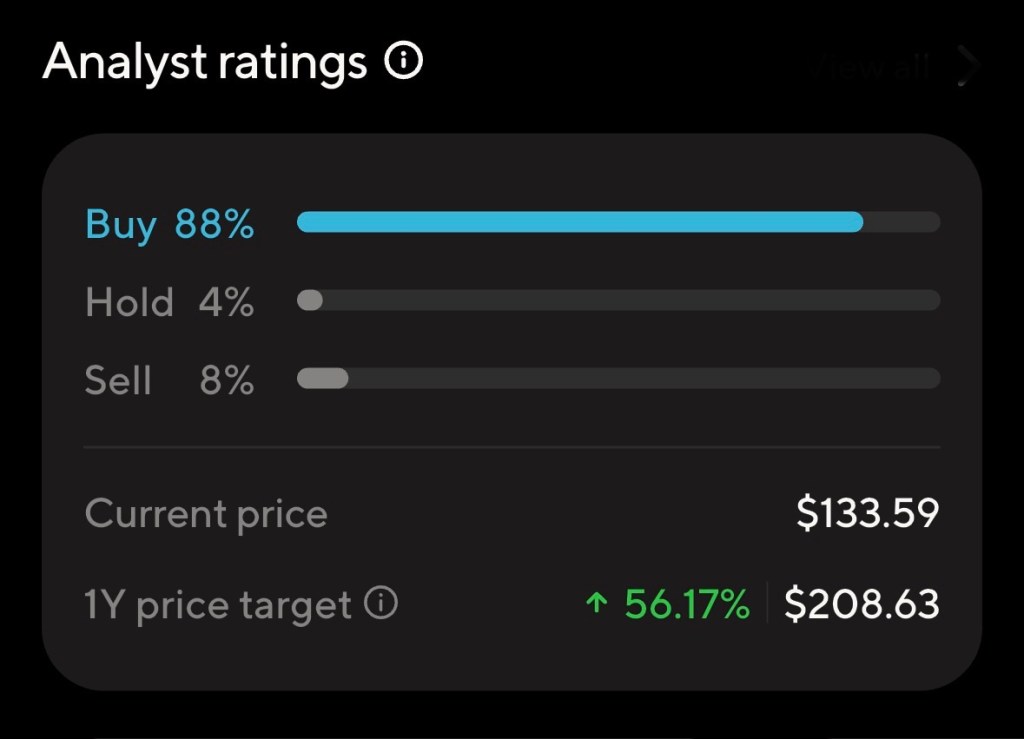
  • MarketBeat Consensus: Average 12-month price target of $209.07 — implying approximately 57% potential upside from current levels. (MarketBeat)
  • TipRanks Data: Average analyst target range of $170 to $263, with a “Strong Buy” consensus overall. (TipRanks)
  • Bullish Scenarios: Some analysts project further expansion toward historical peer valuations if growth and AI monetization accelerate. (TIKR.com)

Projected Price Range in One Year: $180–$250, contingent upon execution of AI initiatives, macro stability, and continued enterprise software demand.


Disclosure

I currently hold a position in ServiceNow (NYSE: NOW). This article is for informational purposes only and does not constitute financial advice. Investors should conduct independent research before making investment decisions.


References

Investing.com. (2025, October 30). Wells Fargo raises ServiceNow stock price target to $1,275 on higher estimates. Retrieved from Investing.com. Investing.com
MarketBeat. (2026). ServiceNow (NOW) Stock Forecast & Price Target. Retrieved from MarketBeat. MarketBeat
MarketWatch. (2026, January). ServiceNow Inc. stock data. Retrieved from MarketWatch. MarketWatch
TradingView/ Invezz. (2026). Here’s why the ServiceNow stock price is tanking. Retrieved from TradingView. TradingView
TechSite (TS2.Tech). (2026, January 24). ServiceNow stock price jumps 3.5% into earnings week. Retrieved from TS2.Tech. TechStock²
Tikr (2026). After a 31% fall in the last 12 months, can ServiceNow recover in 2026? Retrieved from Tikr. TIKR.com
WSJ. (2026). OpenAI and ServiceNow Strike Deal to Put AI Agents in Business Software. Retrieved from The Wall Street Journal. The Wall Street Journal
ServiceNow Investor Relations. (2025). ServiceNow Reports Second Quarter 2025 Financial Results. Retrieved from ServiceNow IR. ServiceNow Investor Relations
GuruFocus News. (2025, October 30). ServiceNow Inc (NOW) Q3 2025 Earnings: EPS of $2.40 Beats Estimates. Retrieved from GuruFocus. GuruFocus

The Baldwin Group (NASDAQ: BWIN) Strengthens Market Position Through Strategic Acquisitions and Growth Initiatives

January 15, 2026 – Tampa, FLThe Baldwin Group (NASDAQ: BWIN), a leading independent insurance brokerage and advisory firm, is making notable strides in expanding its national footprint through a series of strategic acquisitions and corporate actions, moves that have attracted investor interest and helped support recent gains in its stock price.

In the last several months, Baldwin has completed multiple significant transactions. The company finalized its acquisition of Obie, a Chicago-based embedded landlord insurance distribution platform that has delivered extraordinary revenue growth since 2021. Obie’s insurance technology and nationwide distribution capabilities are expected to strengthen Baldwin’s real estate investor solutions and support broader adoption of embedded insurance offerings. (Stock Titan)

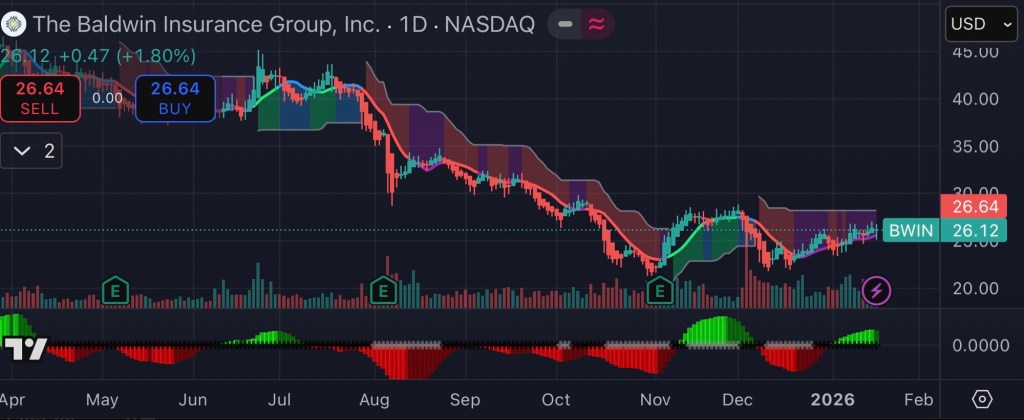
Shortly after the Obie announcement in mid-January 2026, Baldwin’s stock experienced a noticeable uptick, with shares rising over 3.6% on acquisition news a clear sign of investor confidence in Baldwin’s growth strategy. (IndexBox)

In early 2026, Baldwin also completed the acquisition of Capstone Group, a full-service Philadelphia-area insurance brokerage firm. Capstone expands Baldwin’s regional reach and adds new capabilities in risk management, group health, and ancillary benefit lines further diversifying Baldwin’s portfolio of services. (Investing.com)

Perhaps most transformational is the company’s $1.026 billion merger with CAC Group, a specialty and middle-market insurance brokerage transaction completed in early January 2026. This strategic combination positions Baldwin among the largest independent insurance advisory platforms in the U.S., adding unparalleled specialty expertise in sectors like cyber, financial lines, construction, natural resources, and private equity. (Stock Titan+1)

Financially, Baldwin has shown consistent growth in revenue and organic expansion across reporting periods in 2025. Third-quarter results reported revenue growth of 8% and continued adjusted earnings momentum, even as the company navigates through net losses on a GAAP basis. (Business Wire)

According to recent stock data, BWIN’s share price has reflected both volatility and opportunity. As of mid-January 2026, BWIN shares traded near $25.48, with a 52-week range of approximately $21.26 to $47.15. Analysts maintain a mixed outlook, with a consensus price target higher than current levels but tempered by risks related to integration and profitability challenges. (StockAnalysis)

Capital and Debt Strategy
Alongside these strategic acquisitions, The Baldwin Group has successfully priced an incremental $600 million Term Loan B, which upsizes its existing credit facility and provides flexibility to fund acquisitions and refinance existing borrowings. This capital strategy supports Baldwin’s expansion while managing leverage levels that accompany rapid growth. (Stock Titan)

Investment Considerations and Risks
Investors considering exposure to BWIN should be aware that, while the company is scaling rapidly, it continues to report net losses on a GAAP basis and carries a significant debt load tied to its acquisition strategy. Meanwhile, adjusted performance metrics demonstrate improving profitability trends that could support future valuation performance if realized. (Baldwin+1)

Disclosure: I hold a position in The Baldwin Group (BWIN), and the views expressed above reflect only general observations of recent developments and publicly available data.


References

IndexBox. (2026, January 15). Baldwin Insurance Group stock rises on Obie acquisition news.
Stockanalysis.com. (2026). The Baldwin Insurance Group (BWIN) Stock Price & Overview.
Business Wire. (2025). The Baldwin Group announces fourth quarter and full year 2024 results.
Business Wire. (2025, November 4). The Baldwin Group announces third quarter 2025 results.
StockTitan. (2026, January). The Baldwin Group completes acquisition of Obie and Capstone Group.
BeyondSPX. (2026, January). Baldwin Group completes $1.026 billion merger with CAC Group.
StockTitan. (2024). The Baldwin Group announces successful pricing of $600 million incremental Term Loan B.

Mastering Dollar-Cost Averaging for Long-Term Wealth

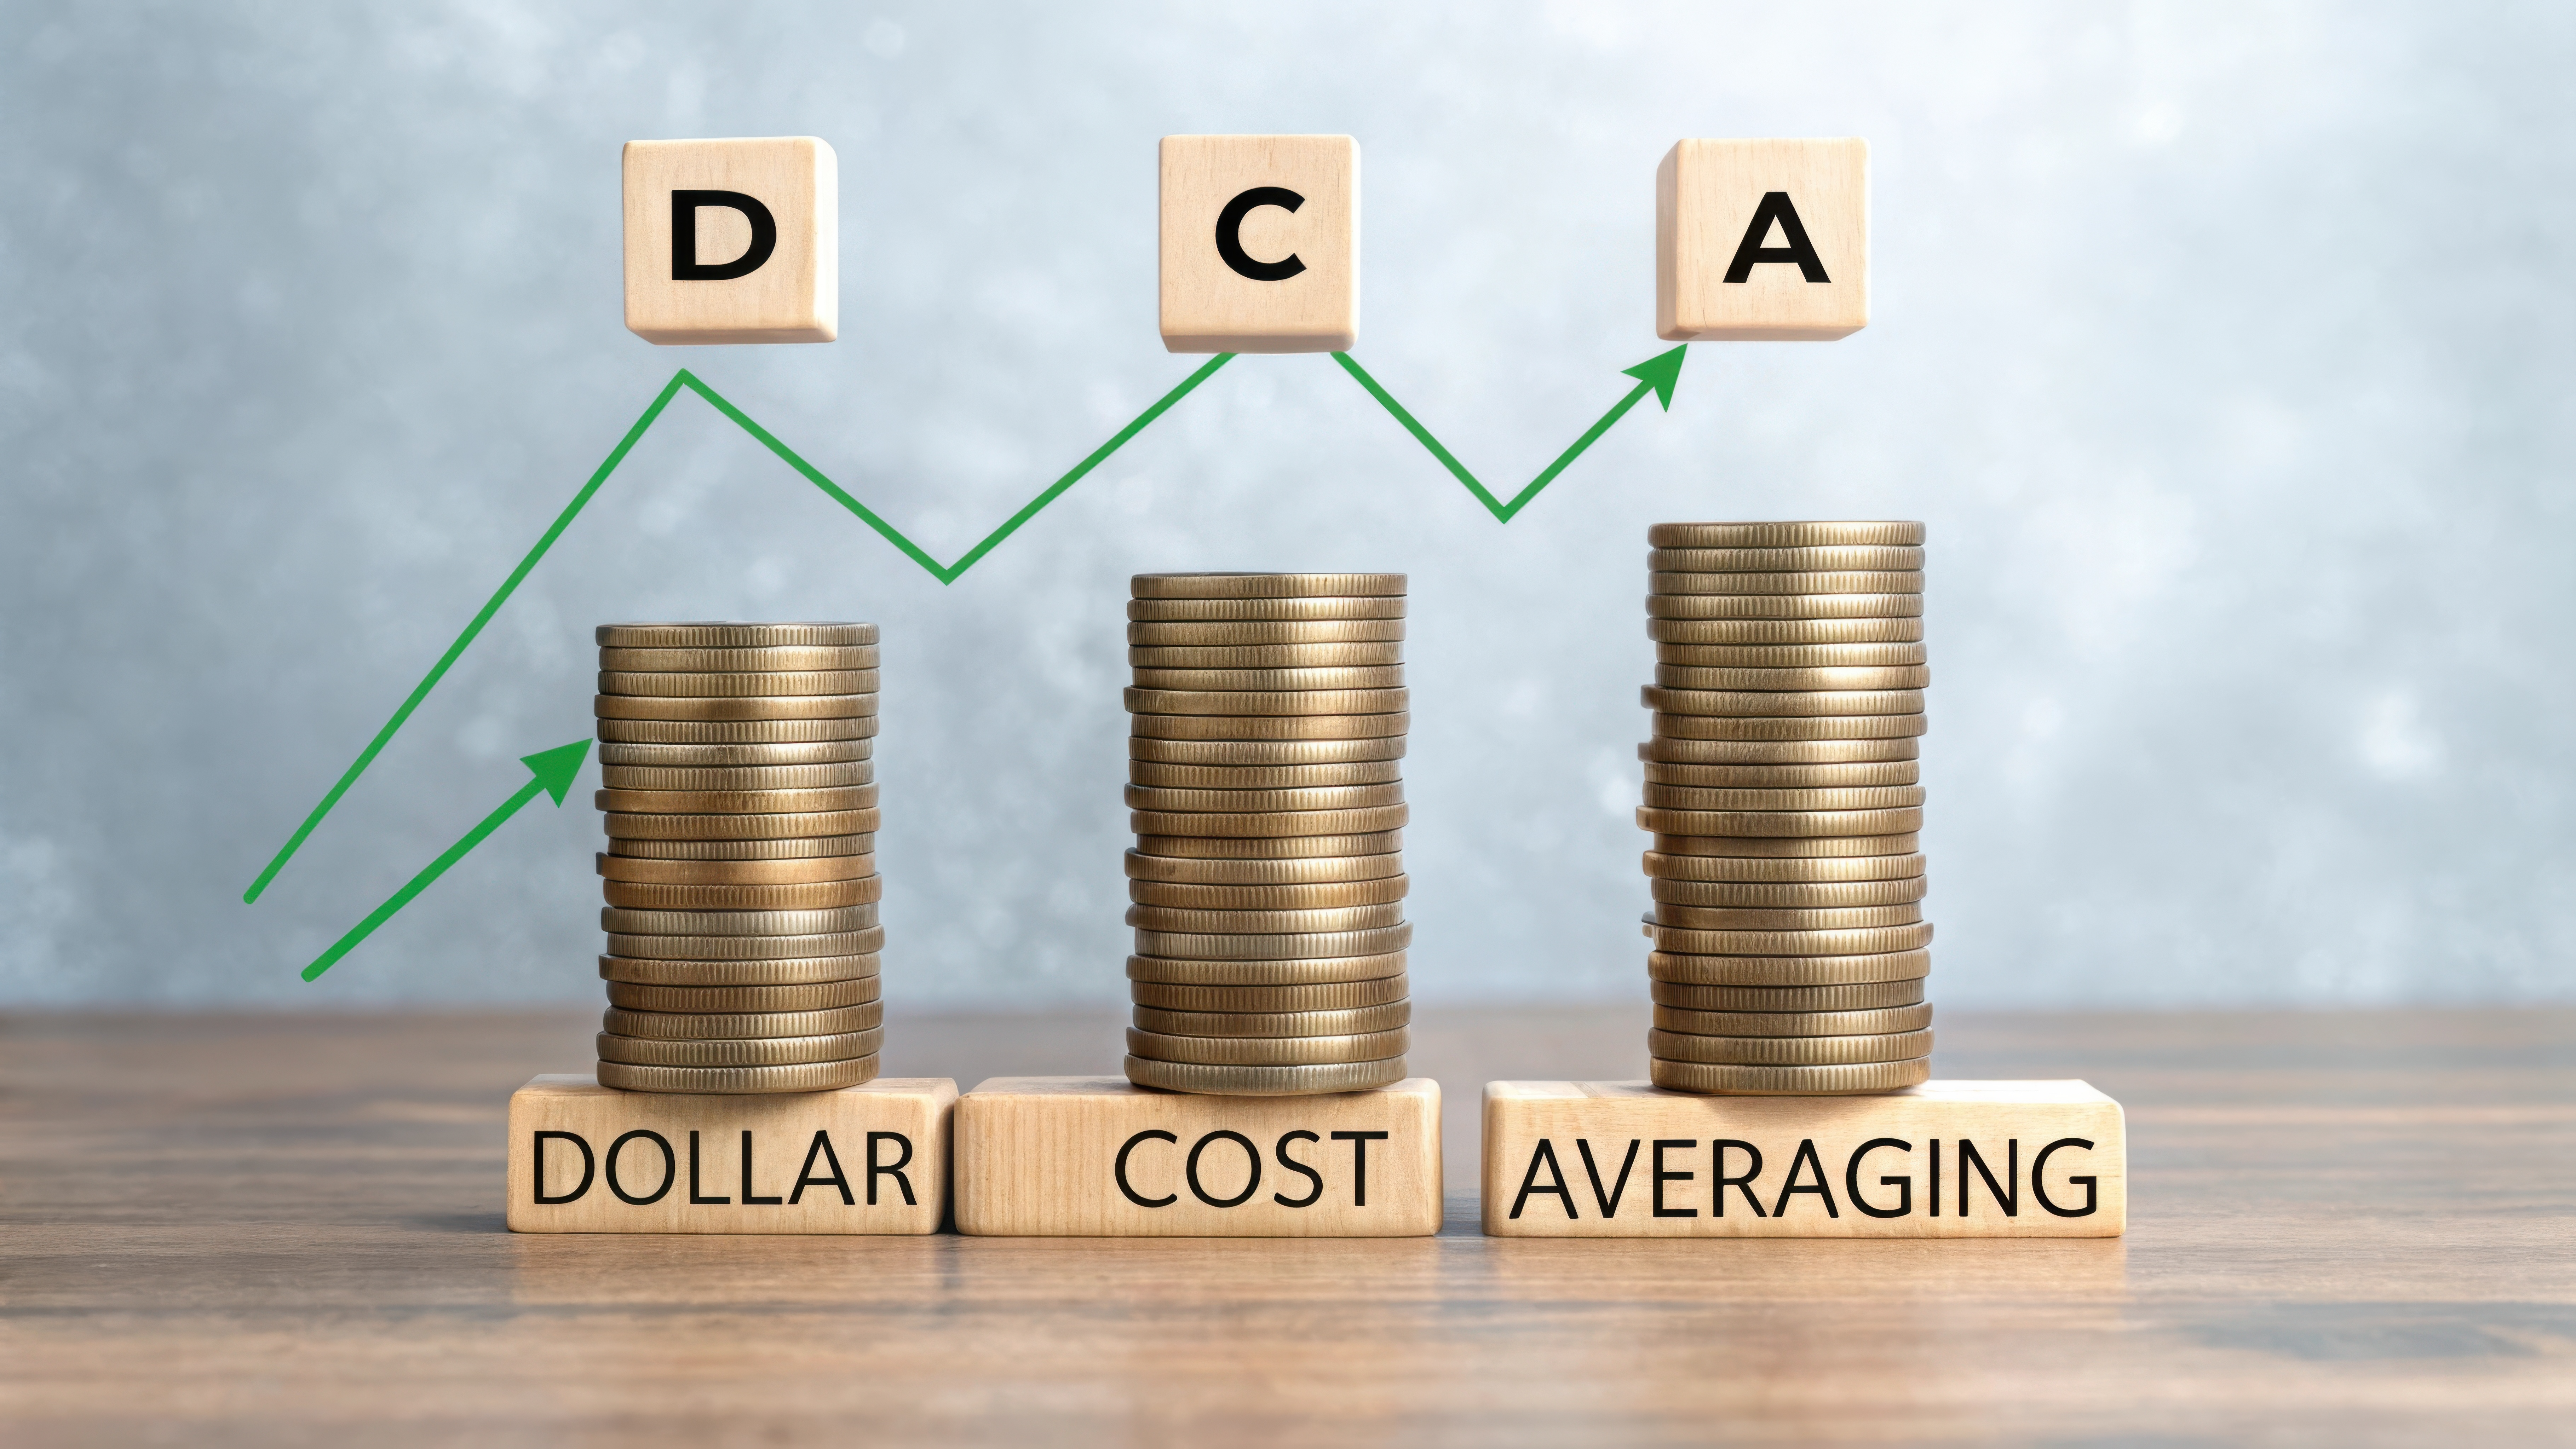
For many investors, the most difficult part of building wealth in the stock market is not choosing the right company it is deciding when to invest. Market volatility, headlines, and fear of buying at the “wrong time” often cause investors to sit on the sidelines. Dollar-cost averaging (DCA) offers a straightforward solution to this problem, making it one of the easiest and most effective ways to ease into a stock position for long-term investing.

What Is Dollar-Cost Averaging?

Dollar-cost averaging is an investment strategy where an investor commits to investing a fixed dollar amount into a stock, exchange-traded fund (ETF), or mutual fund at regular intervals such as weekly, biweekly, or monthly regardless of the asset’s price.

Instead of investing a lump sum all at once, DCA spreads purchases over time. When prices are high, the fixed dollar amount buys fewer shares. When prices are low, the same amount buys more shares. Over time, this approach results in an average purchase price that reflects market fluctuations rather than a single entry point.

Why DCA Works for Long-Term Investors

1. Reduces Market Timing Risk
Trying to time the market consistently is extremely difficult, even for professionals. Dollar-cost averaging removes the pressure to predict short-term price movements. By investing consistently, investors participate in the market regardless of temporary highs or lows.

2. Eases Emotional Decision-Making
Emotions such as fear and greed often lead to poor investment decisions. DCA introduces discipline by turning investing into a routine process rather than a reaction to market news. This structure helps investors stay invested during periods of volatility, which are critical for long-term success.

3. Smooths Volatility Over Time
Markets are inherently volatile in the short term. DCA naturally takes advantage of price swings by purchasing more shares during market pullbacks. Over long periods, this can lower the average cost per share compared to investing all funds at a single market peak.

4. Encourages Consistent Investing Habits
Dollar-cost averaging aligns well with regular income cycles, such as paychecks. This makes it easier for investors to build positions gradually without waiting for large sums of capital. Consistency is a key driver of long-term portfolio growth.

Why DCA Is Ideal for Easing Into a Stock Position

For investors initiating a new stock position, especially in a volatile or uncertain market, DCA provides a measured and controlled entry. Rather than committing all capital at once, investors can scale into the position over months or even years, allowing the investment thesis to play out while limiting short-term downside risk.

This approach is particularly effective for:

  • Long-term growth stocks
  • Broad market ETFs
  • Retirement and taxable investment accounts
  • Investors new to the market or returning after a pullback

Long-Term Results Matter More Than Perfect Timing

While lump-sum investing can outperform in steadily rising markets, dollar-cost averaging shines when volatility is present an increasingly common feature of modern markets. More importantly, DCA helps investors stay invested, which historically has mattered far more than finding the perfect entry point.

Over time, markets have demonstrated an upward bias driven by earnings growth, innovation, and economic expansion. Dollar-cost averaging allows investors to participate in that long-term trend without the stress of short-term market noise.

The Last Word

Dollar-cost averaging is not about maximizing short-term gains it is about building wealth steadily and responsibly. By reducing timing risk, minimizing emotional mistakes, and encouraging consistent participation, DCA stands out as one of the simplest and most effective strategies for easing into a stock position and staying committed to long-term investing goals.

For investors focused on patience, discipline, and long-term growth, dollar-cost averaging remains a proven and accessible strategy in any market environment.

Talos Energy (NYSE: TALO): A Strategic Energy Investment Entering 2026

Talos Energy Inc. (NYSE: TALO), an independent offshore oil and gas exploration and production company focused primarily on the U.S. Gulf of Mexico, is emerging as a notable energy equity entering 2026. With improving operational efficiency, disciplined capital allocation, and renewed analyst optimism, Talos presents a risk-adjusted opportunity for investors seeking exposure to offshore energy assets.

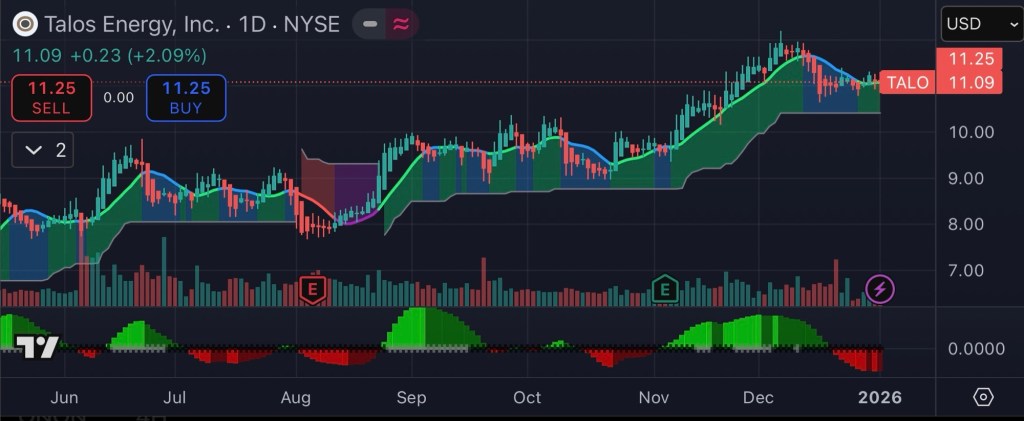
As of early January 2026, Talos Energy shares are trading near $11.25, recently touching a 52-week high of approximately $11.64, reflecting improving technical momentum and investor sentiment (Investing.com, 2025).

Operational Performance and Financial Progress

Talos Energy reported solid operational execution throughout 2025 despite a volatile commodity pricing environment. In its third quarter 2025 earnings report, the company disclosed average production of approximately 95.2 thousand barrels of oil equivalent per day (MBoe/d), supported by strong performance across its core offshore assets (Talos Energy Inc., 2025a).

Notably, Talos generated over $100 million in adjusted free cash flow during Q3 2025, enabling share repurchases and reinforcing management’s emphasis on shareholder returns and balance sheet strength (Talos Energy Inc., 2025a). While net income remained pressured by non-cash impairment charges, free cash flow generation has become a central pillar of the company’s investment thesis.

Strategic Initiatives and Growth Drivers

Talos has outlined an enhanced corporate strategy aimed at improving capital efficiency and long-term cash flow sustainability. Management has indicated a goal of achieving approximately $100 million in incremental annualized cash flow entering 2026, driven by operational efficiencies, optimized drilling programs, and cost discipline (Talos Energy Inc., 2025b).

Exploration remains another key catalyst. The company’s Daenerys discovery in the Gulf of Mexico has shown promising results, with appraisal drilling planned for 2026. Successful development could materially expand Talos’ reserve base and future production profile (Talos Energy Inc., 2025a).

In addition, broader offshore industry trends may serve as tailwinds. According to Reuters (2025), improved drilling economics and declining onshore productivity are refocusing attention on offshore Gulf of Mexico assets, potentially supporting higher long-term valuations for companies like Talos.

Market Sentiment and Analyst Outlook

From a technical perspective, Talos Energy has demonstrated improving relative strength. The stock earned a Relative Strength (RS) Rating above 80, signaling outperformance versus the broader market and attracting momentum-oriented investors (Investor’s Business Daily, 2025).

Analyst sentiment is moderately bullish. Consensus estimates reflect an average 12-month price target near $14–$15, with more optimistic forecasts reaching $20 per share, implying meaningful upside if execution and commodity pricing align favorably (StockAnalysis.com, 2025; Investing.com, 2025).

Risks to Consider

Despite improving fundamentals, Talos Energy is not without risk. The company remains sensitive to fluctuations in oil and natural gas prices, and earnings volatility persists due to capital-intensive offshore operations. Exploration results, regulatory considerations, and macroeconomic factors could all impact performance.

Investors should also note that sustained profitability has yet to be firmly established on an annual basis, making execution in 2026 a critical determinant of valuation expansion.

2026 Price Outlook

Based on current fundamentals, analyst projections, and sector trends, several scenarios appear plausible for Talos Energy by the end of 2026:

  • Base Case: Stable commodity prices and continued execution support a valuation in the $14–$16 range.
  • Bullish Case: Successful exploration, higher oil prices, and sustained free cash flow expansion could drive shares toward $18–$20+.
  • Bearish Case: Commodity weakness or operational setbacks may limit upside and keep shares range-bound near current levels.

Conclusion

Talos Energy enters 2026 positioned as a leveraged play on offshore energy resilience and operational discipline. While risks remain inherent, the company’s improving free cash flow profile, exploration upside, and favorable analyst sentiment suggest that TALO may offer attractive long-term potential for investors with a tolerance for volatility.


Disclosure

The author owns a position in Talos Energy (NYSE: TALO). This article is for informational purposes only and does not constitute financial or investment advice. Readers are strongly encouraged to conduct their own research and consult a qualified financial professional before making any investment decisions.


References

Investing.com. (2025, December 3). Talos Energy stock reaches 52-week high at 11.64 USD. Investing.com. https://www.investing.com/news/company-news/talos-energy-stock-reaches-52week-high-at-1164-usd-93CH-4388939

Investor’s Business Daily. (2025, December 30). Stocks showing improving market leadership: Talos Energy earns 81 RS rating. https://www.investors.com/ibd-data-stories/stocks-showing-improving-market-leadership-talos-energy-earns-81-rs-rating/

Reuters. (2025, October 15). Improved drilling to boost Gulf of Mexico offshore oil output as U.S. onshore growth slows. Reuters. https://www.reuters.com/business/energy/improved-drilling-boost-gulf-mexico-offshore-oil-output-us-onshore-growth-slows-2025-10-15/

StockAnalysis.com. (2025). Talos Energy (TALO) stock forecast and analyst price targets. https://stockanalysis.com/stocks/talo/forecast/

Talos Energy Inc. (2025a, November 5). Talos Energy announces third quarter 2025 operational and financial results. https://www.talosenergy.com/investor-relations/news/news-details/2025/Talos-Energy-Announces-Third-Quarter-2025-Operational-and-Financial-Results/

Talos Energy Inc. (2025b, June 17). Talos Energy announces enhanced corporate strategy. https://www.talosenergy.com/investor-relations/news/news-details/2025/Talos-Energy-Announces-Enhanced-Corporate-Strategy/

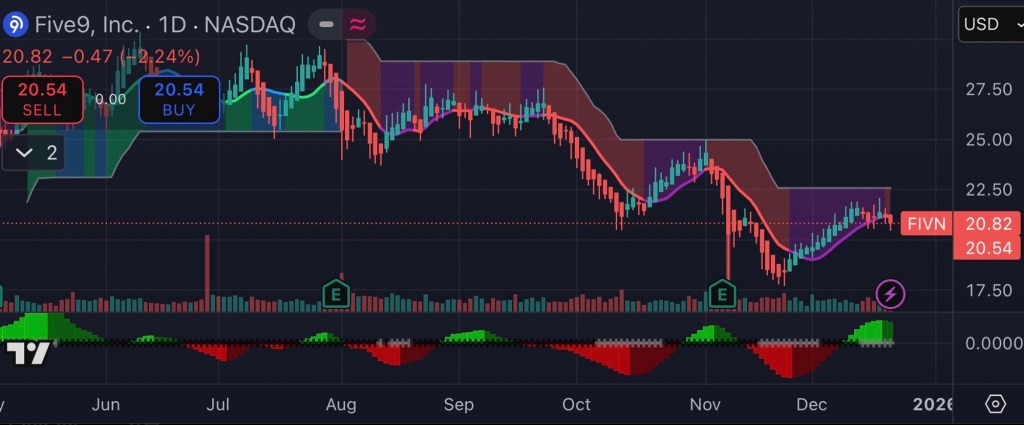
Five9, Inc. (NASDAQ: FIVN): Evaluating a Cloud Communications Leader Heading Into 2026

Five9, Inc. is a leading provider of cloud-based contact center software, operating within the rapidly expanding Contact Center as a Service (CCaaS) market. As enterprises continue to modernize customer engagement through artificial intelligence and cloud infrastructure, Five9’s platform positions the company at the intersection of digital transformation and customer experience optimization (Five9, Inc., 2025).


Company Overview

Founded in 2001, Five9 delivers cloud-native contact center solutions that integrate voice, digital channels, workforce optimization, and AI-powered automation. The company’s offerings are designed to help enterprises improve customer satisfaction while reducing operational complexity and costs. Five9 primarily serves mid-market and large enterprise customers, with a business model heavily weighted toward recurring subscription revenue (Trefis, 2025).

The CCaaS market continues to benefit from long-term secular tailwinds, including remote work adoption, omnichannel customer engagement, and enterprise investment in AI-driven customer support solutions (Seeking Alpha, 2025).


Financial Performance and Health Snapshot

Revenue and Growth

Five9 reported record full-year revenue exceeding $1 billion, reflecting consistent double-digit growth driven by enterprise adoption and expanding AI-enabled services (Five9, Inc., 2024). Recent quarterly results show revenue growth in the low double-digit range, signaling moderation from prior hypergrowth years but still outperforming many legacy contact center competitors (Investing.com, 2025a).

Profitability and Margins

Operational efficiency has improved as the company scales. Adjusted EBITDA margins have expanded into the low-to-mid 20% range, supported by higher software margins and disciplined cost management (Seeking Alpha, 2025). While GAAP profitability remains pressured by stock-based compensation, non-GAAP earnings and free cash flow generation have shown steady improvement (NASDAQ, 2025).

Balance Sheet Strength

Five9 maintains a solid liquidity position, supported by cash reserves and manageable debt levels. The company has also authorized share repurchase activity, signaling management confidence in long-term value creation despite near-term stock volatility (Investing.com, 2025b).


Stock Price and Market Performance

As of late 2025, Five9 shares have experienced significant price compression, trading well below prior cycle highs. The stock recently touched a 52-week low, reflecting broader SaaS sector multiple contraction, investor caution around growth deceleration, and macroeconomic uncertainty (Investing.com, 2025c).

Despite the decline, valuation metrics such as price-to-sales and enterprise-value-to-revenue ratios now sit below historical averages for high-quality SaaS peers, suggesting the market may be discounting future growth more aggressively than current fundamentals justify (NASDAQ, 2025).


Why Five9 May Be an Attractive Investment Heading Into 2026

1. AI-Driven Product Expansion

Five9 continues to embed artificial intelligence across its platform, including intelligent virtual agents, real-time analytics, and automation tools. AI-related revenue has grown faster than the company’s core business, positioning Five9 to benefit from rising enterprise demand for scalable, automated customer engagement (Seeking Alpha, 2025).

2. Recurring Revenue Visibility

A substantial majority of Five9’s revenue is derived from subscriptions, providing predictable cash flows and improved earnings visibility. This recurring model is a key attribute investors seek in mature SaaS companies navigating economic cycles (Trefis, 2025).

3. Margin Expansion Potential

As growth stabilizes and operating leverage improves, Five9 has the potential to further expand margins, particularly if AI-driven products command premium pricing and reduce customer churn (NASDAQ, 2025).

4. Strategic Optionality

Ongoing consolidation within the cloud communications and enterprise software space creates potential upside through partnerships, acquisitions, or strategic interest from larger technology firms seeking to expand their customer experience portfolios (Investing.com, 2025b).


Risks and Considerations

While the long-term outlook remains constructive, investors should remain mindful of several risks. These include intensified competition from well-capitalized rivals, potential delays in enterprise spending, and the possibility that revenue growth continues to decelerate more rapidly than expected (Investing.com, 2025a). Additionally, broader market sentiment toward technology stocks could continue to influence valuation multiples independent of company performance.


Conclusion

Five9 enters 2026 as a financially stable, AI-focused SaaS company operating in a structurally growing market. Although near-term growth has moderated and share price volatility remains elevated, improving margins, recurring revenue strength, and expanding AI capabilities provide a foundation for potential long-term value creation. For investors willing to tolerate short-term uncertainty, Five9 represents a company where fundamentals and market valuation may diverge heading into the next phase of the cloud communications cycle (Five9, Inc., 2025; Seeking Alpha, 2025).

Disclosure:
I do not hold, directly or indirectly, any equity position in Five9, Inc. (NASDAQ: FIVN) at the time of writing. This article is provided for informational and educational purposes only and should not be construed as investment advice, a recommendation to buy or sell securities, or a solicitation of any investment strategy. Readers should conduct their own due diligence and consult a qualified financial professional before making any investment decisions.


References (APA Format)

Five9, Inc. (2024). Five9 reports record full-year revenue exceeding $1 billion. Five9 Investor Relations.
https://investors.five9.com

Five9, Inc. (2025). Quarterly earnings and financial results. Five9 Investor Relations.
https://investors.five9.com/financials

Investing.com. (2025). Five9 stock hits 52-week low amid market volatility.
https://www.investing.com

Investing.com. (2025). Cantor Fitzgerald lowers Five9 price target citing growth moderation.
https://www.investing.com

NASDAQ. (2025). Five9, Inc. (FIVN) stock quote, financials, and performance data.
https://www.nasdaq.com

Seeking Alpha. (2025). Five9: AI-driven contact center growth and margin expansion.
https://www.seekingalpha.com

Trefis. (2025). Five9 business model, revenue mix, and valuation analysis.
https://www.trefis.com

Mission Produce ($AVO): The avocado company worth a closer look

Mission Produce, Inc. (NASDAQ: AVO) is a vertically integrated supplier of fresh Hass avocados (and growing categories such as blueberries and mangoes). The company’s mission centers on reliably sourcing, ripening, packing and distributing high-quality avocados year-round while expanding into complementary produce categories to smooth seasonality and add higher-margin lines for customers. (SEC+1)

Why some investors call $AVO a “hidden gem”
• Scale in a tight market: Mission Produce reported trailing-12-month revenue of roughly $1.4B (TTM), driven by higher selling prices and broadening sourcing to Peru, Mexico, Guatemala and other regions — giving it scale in an industry with frequent supply shocks. (Yahoo Finance+1)
• Recent momentum in results: the company reported Q2 fiscal-2025 revenue of $380.3M (up ~28% year-over-year) and continued quarter-to-quarter revenue strength into Q3, reflecting strong demand and price environment for Hass avocados. Those beats have grabbed investor attention. (Mission Produce Investors+1)
• Diversification & supply-footprint: Mission is investing in packhouses and farming operations (including expansion in Guatemala and development of blueberry and mango programs), which helps reduce single-market exposure and gives operational levers when avocado prices swing. (Blue Book Services+1)
• Clean-ish balance sheet for a seasonal ag business: total assets are roughly $1.0B with total liabilities around $402M (SEC filings / investor materials show positive shareholders’ equity and manageable long-term debt) — positioning it to withstand seasonal price swings and invest in capacity. (SEC+1)

Key risks
• Commodity and weather risk: avocados are sensitive to weather (El Niño, droughts) and geopolitical trade/tariff moves; supply disruptions can quickly swing margins. (MarketWatch)
• Price cyclicality: the company’s Marketing & Distribution segment drives most revenue, so falling avocado prices can reduce top-line even as volumes rise. (Cash Flow Templates)

📈 Current Price & 12-Month Outlook

As of December 4, 2025, AVO shares trade around US$12.03 per share. (MarketBeat+2StockAnalysis+2) According to recent analyst consensus, many project a 12-month target price of about US $17.00 — implying a potential upside of roughly 40–45% over the next year. (StockAnalysis+2Zacks+2)

If conditions remain favorable — robust demand for avocados, stable supply (including from diversified growing regions), and continued execution on expansion initiatives — AVO could reach or even modestly exceed that $17 target. However, risks such as commodity-price swings, weather events, and shifting consumer demand could temper gains. As with all agriculture-linked equities, the upside remains meaningful but also volatile.

Bottom line
Mission Produce combines market leadership in a high-growth consumer category (avocados), rising scale and an improving product mix. That combination — plus a balance sheet that appears able to support continued investment — is why some investors view $AVO as a “hidden gem” in ag/food distribution. But it remains a cyclical, weather-sensitive play; prospective buyers should weigh valuation, seasonality, and tariff/volume outlooks before acting. (Yahoo Finance+1)

Disclosure: I currently hold a position in Mission Produce, Inc. (NASDAQ: AVO). All information provided is for informational and educational purposes only and should not be interpreted as financial advice, investment recommendations, or an endorsement to buy or sell any security. Investors should conduct their own research and consult with a qualified financial professional before making investment decisions.

References

MarketBeat. (2025, December 4). Mission Produce (AVO) Stock Forecast & Price Target 2025. https://www.marketbeat.com/stocks/NASDAQ/AVO/forecast/ MarketBeat

StockAnalysis.com. (n.d.). Mission Produce, Inc. (AVO) Stock Price & Overview. https://stockanalysis.com/stocks/avo/ StockAnalysis

Zacks. (n.d.). Mission Produce, Inc. (AVO) Price Target & Stock Forecast. https://www.zacks.com/stock/research/AVO/price-target-stock-forecast Zacks

Investing.com. (n.d.). Mission Produce Inc (AVO) Consensus Estimates. https://www.investing.com/equities/mission-produce-inc-consensus-estimates Investing.com

Yahoo Finance. (n.d.). Mission Produce (AVO) Stock Quote & Summary. https://finance.yahoo.com/quote/AVO/ Yahoo Finance+1

Understanding the Santa Claus Rally: A Swing Trader’s Guide

As the calendar closes out and holiday cheer replaces headline noise, U.S. stock markets often show a predictable burst of strength known as the Santa Claus Rally — a short, historically favorable window that many swing traders lean on for quick, low-risk setups. The rally is narrowly defined, reliably rewarded by the data, and backed by a handful of market mechanics (low volume, year-end flows, tax-related reversals) that can amplify short-term moves exactly the conditions swing traders seek. (Investopedia+1)

What is the Santa Claus Rally (timeframe)?

The conventional definition credited to Yale Hirsch and the Stock Trader’s Almanac is the last five trading days of December plus the first two trading days of January (a seven-trading-day window). That short span is when seasonal strength historically concentrates, rather than across the whole of December. (Stock Trader’s Almanac+1)

The numbers: how the S&P 500 and Dow have performed

  • S&P 500: Since roughly 1950, the S&P 500 has averaged about +1.3% over the seven trading days of the Santa Claus Rally, with positive returns roughly 78–79% of the time. That beats a typical seven-day period’s average return and win-rate. (Investopedia+1)
  • Dow Jones Industrial Average: Using the classic post-Christmas window, the Dow has historically been positive about 77% of the time, with average gains in the same ballpark as the S&P by some measures (studies often report roughly +1.4% in the period). (MarketWatch+1)
  • Relative context: Analysts note the Santa Claus window’s 1.3% average gain contrasts with a much smaller average seven-day return (around 0.3%), underscoring the period’s above-normal edge. (LPL)

(These figures come from long-range studies and market almanacs; different start dates or sample periods shift the precise numbers slightly but not the broad conclusion.) (Stock Trader’s Almanac+1)

Why this period favors swing trading

  1. Condensed upside in a known short window. Swing trading profits from predictable, short moves a seven-day, high-probability uptick is exactly that. Historical win-rates near the ~78% mark give a favorable edge if position sizing and risk controls are used. (Investopedia)
  2. Lower volatility and thinner volume. Holiday trading often sees lighter volume and fewer market-moving news items; prices can drift more cleanly in one direction, letting swing setups (breakouts, momentum continuations, mean-reversion bounces) play out with less intraday whipsaw. (Lower volume can magnify moves in the direction of flows.) (Corporate Finance Institute+1)
  3. End-of-year flows and positioning. Institutional flows (window dressing, year-end rebalancing, bonus/retirement contributions) and a reversal of tax-loss selling can create concentrated buying pressure around year-end and early January. Big inflows into equities have been cited as a driver in some recent Santa rallies. (MarketWatch+1)
  4. Correlation with January and the new year. Historically, a positive Santa Claus Rally has sometimes preceded stronger January returns and a more bullish full year a dynamic that can attract more buyers into the short window and amplify momentum. (This is a correlation, not a guarantee.) (LPL+1)

Practical swing-trader playbook (how to trade it)

  • Time the window. Look for entries during the last five trading days of December and use targets or exits by the first two trading days of January (or earlier if your plan dictates). The edge is short-lived don’t stretch holding periods beyond the seasonality. (Stock Trader’s Almanac)
  • Trade probability, not hope. Use setups with clear technical evidence (breakout on rising RSV/volume, pullback to moving average, bullish RSI divergence). Favor names with existing positive momentum.
  • Risk control is essential. Even periods with high historical win-rates can fail; use tight stops, sensible position sizing, and consider defined-risk instruments (protective puts or small options trades) if you want asymmetric payoff.
  • Use ETFs for broad exposure. If you want to play the seasonal tilt without single-stock risk, liquid ETFs (SPY, QQQ, DIA) can capture the move and provide easy entries/exits.
  • Watch volume & implied volatility. Low volume can help moves trend but can also create thin markets. Options traders should check implied volatility seasonality can compress IV, affecting premium strategies.
  • Consider small-cap/January effect overlap. If you’re a swing trader who also trades small caps, remember the broader January Effect can lift small-cap names in the early month, offering extra upside for appropriately sized trades. (Plus500)

Indicators and signals traders often monitor

  • Short interest and buybacks low supply + active buybacks can help push prices.
  • Seasonal inflows / fund flows (ETF inflows, mutual fund windows) high year-end inflows can sustain rallies. (MarketWatch)
  • Volatility (VIX) trend falling VIX into year-end often accompanies risk-on moves; a sudden spike can kill momentum.
  • Breadth measures (advance/decline lines, number of stocks above 50-day MA) confirm whether the rally is broad-based or just a narrow megacap lift. (Broad rallies are more robust for swing trades across sectors.)

A quick caution

Seasonal patterns are statistical tendencies, not certainties. Past performance is not a guarantee of future results. There have been years without a Santa Claus Rally (and even reverse episodes), and macro surprises — policy shocks, geopolitical events, or sudden earnings shocks can reverse the move. Traders should use the seasonal edge as one input among many, not a sole decision rule. (Morningstar+1)

What this means for investors is simple:

The Santa Claus Rally is a short, well-defined window (last five trading days of December + first two trading days of January) that historically offers above-average returns and a high probability of positive performance for major indices like the S&P 500 and the Dow. Those characteristics concentrated upside, lower intraday noise, and supportive year-end flows make it an attractive environment for disciplined swing traders who pair tight risk controls with high-probability setups. Just remember: seasonality improves the odds, it doesn’t eliminate risk. (Investopedia+2MarketWatch+2)

References

Canopy Wealth. (2024, December 19). What is the Santa Claus Rally? https://www.canopy-wealth.com/blog/what-is-the-santa-claus-rally Canopy Wealth Management
Corporate Finance Institute. (n.d.). Santa Claus Rally – Overview, Causes, Retrospective. https://corporatefinanceinstitute.com/resources/career-map/sell-side/capital-markets/santa-claus-rally/ Corporate Finance Institute
Interactive Brokers. (2024, December 13). Chart Advisor: Get Ready for the Real Santa Claus Rally. https://www.interactivebrokers.com/campus/traders-insight/chart-advisor-get-ready-for-the-real-santa-claus-rally/ Interactive Brokers
InvestingNews. (2024, December 24). What Is the Santa Claus Rally and Has it Arrived? https://investingnews.com/santa-claus-rally/ Investing News Network (INN)
Investopedia. (2024, December 20). Santa Claus Rally: What It Is and Means for Investors. https://www.investopedia.com/terms/s/santaclauseffect.asp Investopedia
Investopedia. (n.d.). The Santa Claus Rally. https://www.investopedia.com/the-santa-claus-rally-4779941 Investopedia
LPL Research. (2025, January 2). Santa Claus Rally in Jeopardy. https://www.lpl.com/research/blog/santa-claus-rally-in-jeopardy.html LPL
SmartAsset. (2025, August 14). Is the Santa Claus Rally Real? – 2020 Study. https://smartasset.com/financial-advisor/santa-claus-rally-2020 SmartAsset
TSPSmart. (n.d.). Santa Claus Rally. https://tspsmart.com/Santa-Claus-Rally TSP Smart

Celsius $CELH: A sip, a chart, and why traders/investors are watching

You try a new drink and “boom” the product tastes great. That’s exactly what happened when I tried a CELSIUS energy beverage and then went to check the stock. Celsius Holdings (ticker CELH) has been one of the market’s high-profile consumer names this year: rapid top-line growth, headline M&A and distribution moves, and a volatile but elevated share price. Here’s a concise news-style breakdown of what the company is doing, where the stock sits now, why some investors think it’s attractive, and what risks to keep in mind.


Where the stock sits right now

As of November 22, 2025, CELH is trading in the ~$39 range after a pullback from summer highs. Recent intraday and close prints in mid–late November show the stock around $38–$44 depending on the day and data feed. (Investing.com+1)

(See the chart below for an illustrative monthly price run from Oct 2022 → Nov 2025.)

The chart — price context

(Illustrative monthly closes Oct 2022 → Nov 2025; compiled show how the stock ran from low-$20s into the $50–$60 range in mid-2025, then pulled back into the high-$30s in November.) The chart below uses monthly close data gathered from public historical-price sources (illustrative).


Quick company snapshot

Celsius Holdings is a challenger in the energy and “fitness” drink space, known for zero-sugar, functional energy beverages marketed toward active consumers. Over the past 18 months the company has accelerated growth through product line extensions, international distribution deals, and material M&A — most notably the purchase of Alani Nu earlier in 2025 and the addition of Rockstar’s U.S. rights to its portfolio (with PepsiCo retaining international Rockstar ownership). The company says combined brands have been growing well above the U.S. energy category. (Celsius Holdings+1)

Revenue has moved from hundreds of millions to more than $1.3 billion in 2024 and showed continued expansion into 2025, reflecting distribution gains and the Alani Nu contribution. (Macrotrends)


Major recent catalysts (what moved the stock)

  • PepsiCo strategic expansion & stake: In August 2025 PepsiCo increased its position via convertible preferred shares and agreed to deepen distribution cooperation PepsiCo’s ownership rose to ~11% and PepsiCo will lead distribution for the combined U.S./Canada energy portfolio. That strategic tie (and a PepsiCo board nomination) materially de-risked parts of Celsius’s distribution story and boosted investor sentiment. (Reuters+1)
  • Acquisitions & brand consolidation: Celsius acquired Alani Nu (female-focused, strong social media presence) and obtained U.S. rights to Rockstar Energy building a “total energy portfolio.” Those moves give Celsius scale, broader consumer reach, and leverage in retailer negotiations. (Celsius Holdings+1)
  • International expansion & flavors: New distribution agreements (e.g., Suntory in the Netherlands) and new flavor launches support deeper retail penetration outside the U.S. and product innovation. (Celsius Holdings)

Investment thesis — why some investors like CELH now

  1. Distribution muscle via PepsiCo having PepsiCo handle distribution in major channels materially increases shelf placement potential and reduces execution risk versus trying to scale purely on indie distribution. The partnership also sends a validation signal from a major CPG player. (Reuters+1)
  2. Brand roll-up strategy combining CELSIUS, Alani Nu and the U.S. Rockstar rights creates cross-sell and SKU strategies, economies of scale on procurement/marketing, and more negotiating power with retailers and foodservice. If integration succeeds, revenue and margin expansion are plausible. (Celsius Holdings)
  3. Strong top-line momentum year-over-year revenue growth has been large over prior years as the product reached mass retail and new channels; that revenue base makes future earnings expansion possible if margins recover. (Macrotrends)
  4. Growth + trading volatility = alpha opportunity for traders, CELH’s pronounced swings around news (earnings, deals, distribution announcements) create short-term setups momentum squeezes, event trades around earnings, and pullback buys after headline consolidation.

Where it might be headed simple scenario sketch (not investment advice)

Below are illustrative, hypothetical scenarios to frame risk/reward. They are not price targets from an analyst they are scenario examples based on company catalysts and typical valuation ranges for high-growth consumer names.

  • Bull case (successful integration & continued distribution lift): If combined brands scale and margins improve, revenue multiples could re-rate and push CELH back toward its summer highs in the $55–$75 range over 6–12 months (driven by multiple expansion + execution). Key drivers: faster retail rollouts via PepsiCo, international growth, margin leverage. (Celsius Holdings+1)
  • Base case (steady growth, some margin pressure): Continued revenue growth but slower margin recovery; stock trades in a midrange band around $35–$55 as investors balance growth with execution risk. (Macrotrends)
  • Bear case (integration/competition trouble, macro slowdown): Execution issues, weaker retail sell-through, or broader consumer pullback could push the stock below $25–$30 if growth disappoints or if the market de-rates high-growth consumer names. (FullRatio)

Sources for price and history: market feeds and historical pages (Investing.com, Yahoo Finance and similar). I(nvesting.com+1)


Risks — what could go wrong

  • Integration risk: acquisitions (Alani Nu, Rockstar U.S. rights) need careful integration; cultural or distribution missteps can sap margin and distract management. (Celsius Holdings)
  • Valuation & volatility: CELH has been a volatile, headline-driven name sharp moves up and down occur on news. Short-term traders may profit, long-term investors must stomach drawdowns. (Investing.com)
  • Competition & category dynamics: energy and functional beverages are crowded (PepsiCo, Monster, Red Bull, private labels); sustained share gains aren’t guaranteed.
  • Profitability swings: EPS over recent trailing periods has been uneven; margins can be pressured by promotional activity and integration costs. (FullRatio)

Bottom line

Celsius is no longer a small niche brand by revenue and deal activity it has scaled into a major, fast-moving name in energy drinks. The PepsiCo strategic tie and brand acquisitions give a clear pathway for distribution and scale, which is why many investors view CELH as an interesting growth play. That said, the stock’s rapid move higher earlier in 2025 and recent pullbacks underline both the upside and the volatility. For traders, event-driven setups and momentum plays can work; for investors, the key questions are whether integration lifts margins and whether PepsiCo’s distribution materially accelerates sustainable growth.

If you liked the drink and are thinking about buying shares, consider: (1) define whether you’re trading or investing, (2) size the position relative to the volatility, and (3) track integration and distribution KPIs (retail placements, foodservice uptake, international rollouts) as the real operational signs that the thesis is working. Official company releases, earnings calls and retail-level data will be the best evidence to watch. (Celsius Holdings+1)


Disclosure: I’m not a licensed financial advisor. This is market commentary and not personalized investment advice. Do your own research (DYOR) check the latest filings and the company’s next earnings release and consider speaking with a licensed professional before trading or investing.


References

Celsius Holdings. (2025). Celsius Holdings reports third quarter 2025 results [Press release]. https://www.celsiusholdingsinc.com/

Investing.com. (2025). Celsius Holdings Inc. (CELH) historical data. Retrieved November 2025, from https://www.investing.com/
(Note: Replace with direct historical-data link if desired.)

Macrotrends. (2025). Celsius Holdings revenue 2015–2025. Retrieved November 2025, from https://www.macrotrends.net/

Reuters. (2025, August 29). PepsiCo boosts stake in energy drink maker Celsius. https://www.reuters.com/

Reuters. (2025). Celsius to buy Alani Nu and combine U.S. rights to Rockstar Energy. https://www.reuters.com/

Yahoo Finance. (2025). Celsius Holdings, Inc. (CELH) stock price & historical data. Retrieved November 2025, from https://finance.yahoo.com/