ServiceNow, Inc. (NYSE: NOW), the enterprise workflow automation and AI-driven software company, is attracting renewed investor attention as it enters its next earnings period with mixed signals from the market. After a prolonged sell-off in 2025 and early 2026, shares have shown signs of stabilization ahead of quarterly results due this week, while analysts revise forecasts on both the upside and downside.

Market Context:
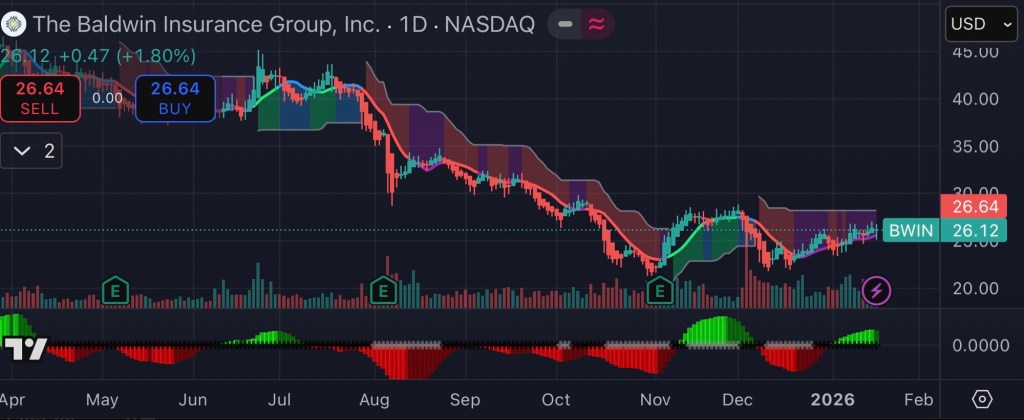
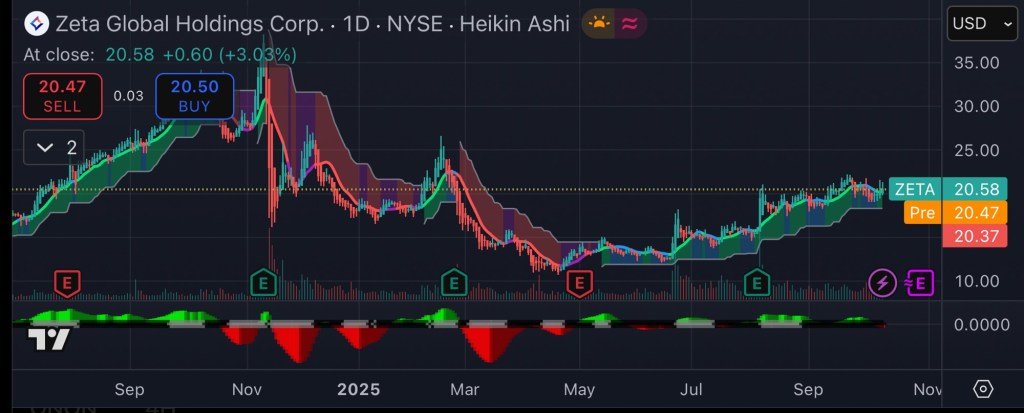
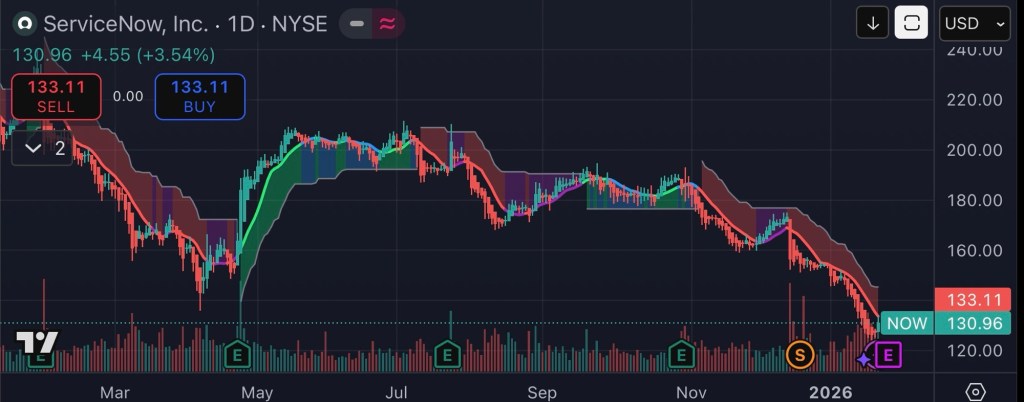
As of the most recent close, ServiceNow’s stock price finished at $133.11, up 3.5% on positive sentiment ahead of earnings week. (TechStock²) The company’s shares have experienced significant pressure over the past year, falling roughly 30–50 percent from prior highs, signaling broader investor caution within the enterprise software sector. (TradingView+1)
Recent Financial Performance
ServiceNow’s underlying financial performance remains robust despite stock price challenges:
| Metric | Most Recent Reported |
|---|---|
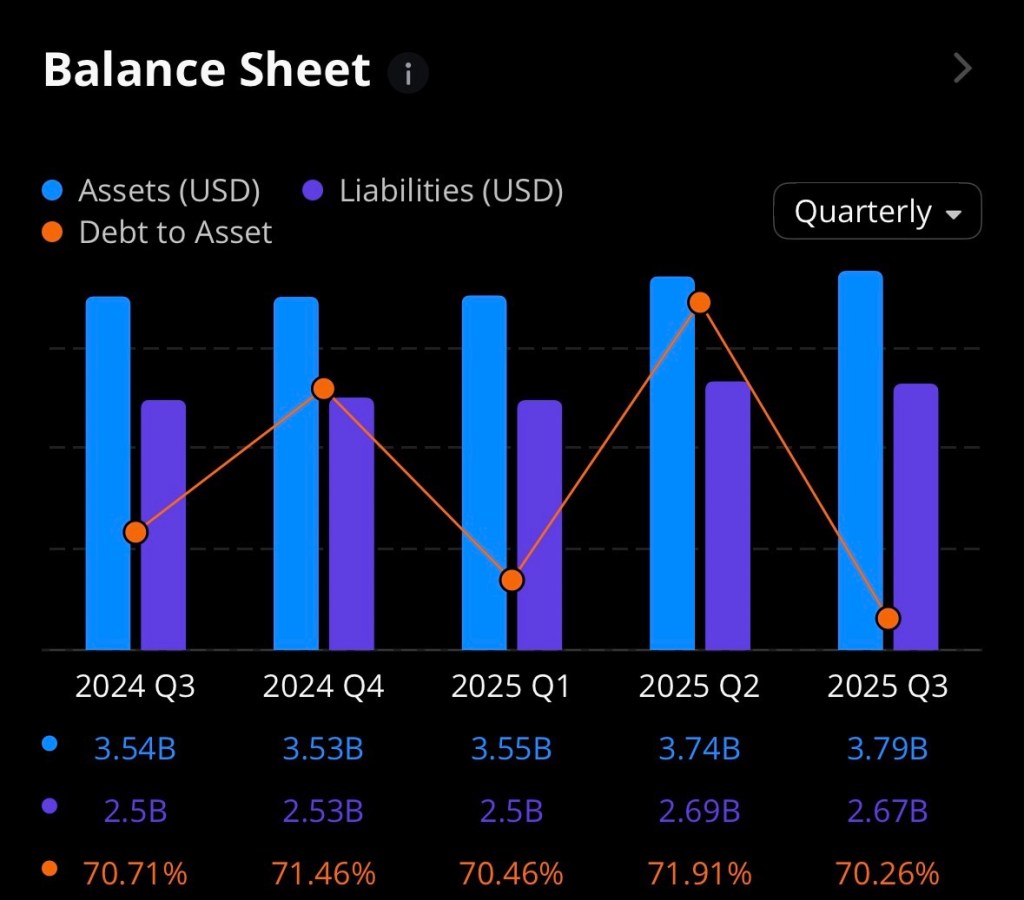
| Q3 2025 Revenue | $3.407 billion (+22% YoY) (GuruFocus) |
| Subscription Revenue | $3.299 billion (+21.5% YoY) (GuruFocus) |
| Q3 2025 EPS | $2.40 (beats expectations) (GuruFocus) |
| Q2 2025 Subscription Revenue | $3.113 billion (+22.5% YoY) (ServiceNow Investor Relations) |
| Performance Obligations (RPO) | $23.9 billion (+29% YoY) (ServiceNow Investor Relations) |
ServiceNow also continues to expand its customer base, with strong demand in large enterprises and sustained growth in contract value obligations. (ServiceNow Investor Relations)
Financial Chart (Selected Historical & Forecast Data):
| Metric / Timeframe | 2024 Actual | 2025 Actual | Analyst 2026 Avg Target |
|---|---|---|---|
| Revenue Growth | ~21% YoY | ~22% YoY | — (Estimated Stable Growth) |
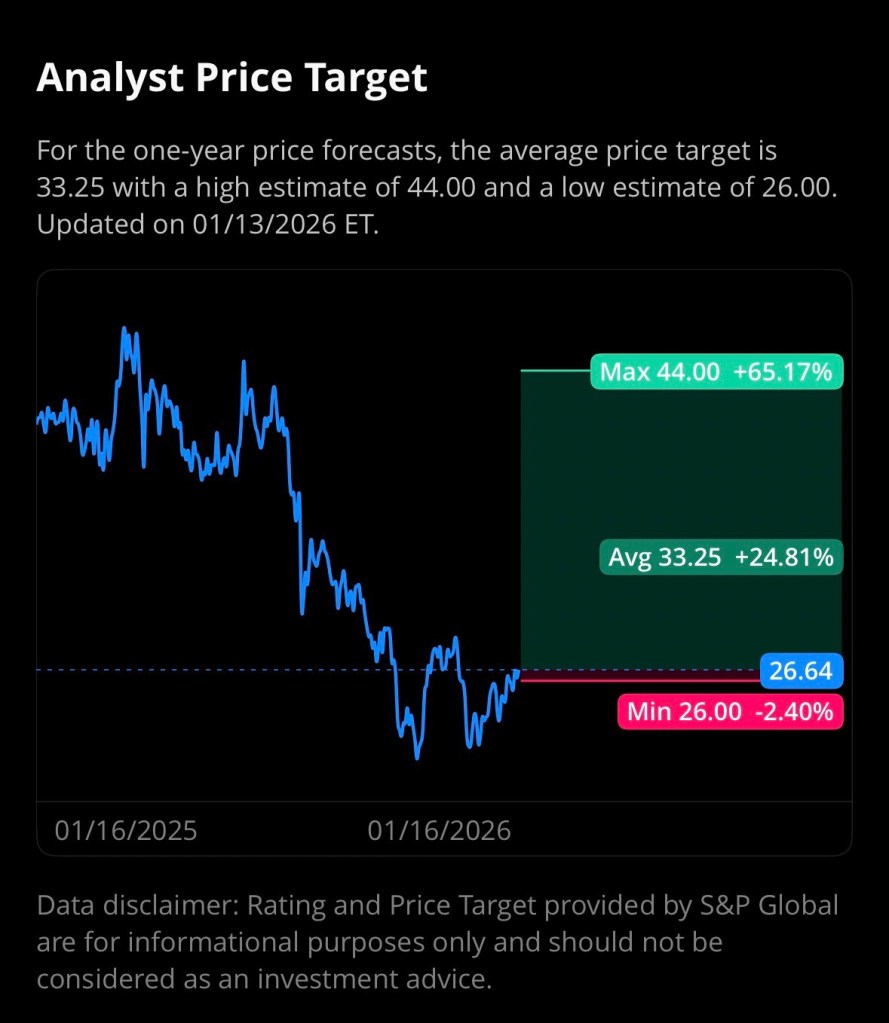
| Stock Price (Year-End) | ~$239.62 (52-wk high) (MarketWatch) | ~$128–134 range (MarketWatch) | Consensus ~ $209.07 Avg (MarketBeat) |
| Analyst Price Target Range | $170–$263 (TipRanks) | Consensus Moderate Buy | $209.07 Average 12-mo (MarketBeat) |
Catalysts and Risks
Positive Drivers:
- AI Integration and Partnerships: The company’s strategic deployment of AI capabilities particularly through deepening enterprise AI products and partnerships positions it within one of the fastest-growing segments of enterprise software. (The Wall Street Journal)
- Earnings Beats: Recent quarters have seen revenue and EPS exceed consensus estimates, reinforcing the company’s pricing power and durability even in more cautious macro environments. (Nasdaq)
- Stock Split Authorization: A board-approved 5-for-1 stock split aims to improve liquidity and broaden retail investor ownership. (Yahoo Finance)
Challenges:
- Valuation Compression: Analysts have trimmed price targets in light of broader software sector rotation, leading to downward revisions that reflect caution ahead of earnings and uncertain macro conditions. (Ad Hoc News)
- Market Sentiment: Software stocks broadly have underperformed amid shifting investor preferences toward semiconductors and AI infrastructure names, contributing to valuation pressure for ServiceNow. (Investopedia)
Analyst Forward Outlook & Stock Price Forecast (Next 12 Months)
Market forecasts reflect a moderate buy consensus for NOW with meaningful upside potential despite short-term volatility:
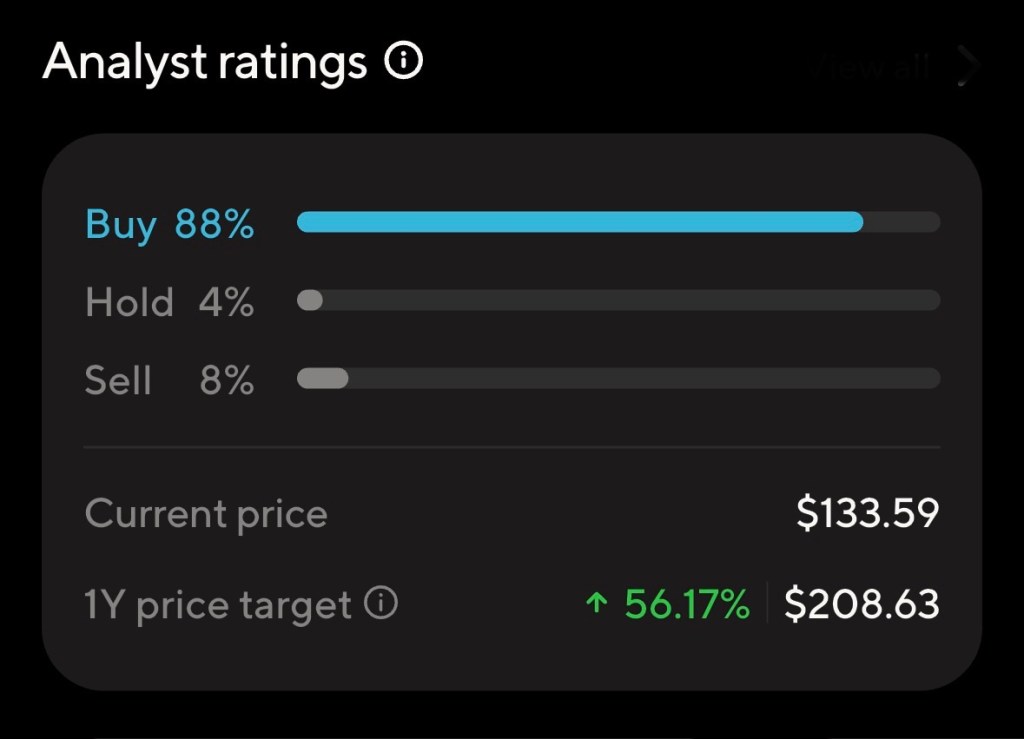
- MarketBeat Consensus: Average 12-month price target of $209.07 — implying approximately 57% potential upside from current levels. (MarketBeat)
- TipRanks Data: Average analyst target range of $170 to $263, with a “Strong Buy” consensus overall. (TipRanks)
- Bullish Scenarios: Some analysts project further expansion toward historical peer valuations if growth and AI monetization accelerate. (TIKR.com)
Projected Price Range in One Year: $180–$250, contingent upon execution of AI initiatives, macro stability, and continued enterprise software demand.
Disclosure
I currently hold a position in ServiceNow (NYSE: NOW). This article is for informational purposes only and does not constitute financial advice. Investors should conduct independent research before making investment decisions.
References
Investing.com. (2025, October 30). Wells Fargo raises ServiceNow stock price target to $1,275 on higher estimates. Retrieved from Investing.com. Investing.com
MarketBeat. (2026). ServiceNow (NOW) Stock Forecast & Price Target. Retrieved from MarketBeat. MarketBeat
MarketWatch. (2026, January). ServiceNow Inc. stock data. Retrieved from MarketWatch. MarketWatch
TradingView/ Invezz. (2026). Here’s why the ServiceNow stock price is tanking. Retrieved from TradingView. TradingView
TechSite (TS2.Tech). (2026, January 24). ServiceNow stock price jumps 3.5% into earnings week. Retrieved from TS2.Tech. TechStock²
Tikr (2026). After a 31% fall in the last 12 months, can ServiceNow recover in 2026? Retrieved from Tikr. TIKR.com
WSJ. (2026). OpenAI and ServiceNow Strike Deal to Put AI Agents in Business Software. Retrieved from The Wall Street Journal. The Wall Street Journal
ServiceNow Investor Relations. (2025). ServiceNow Reports Second Quarter 2025 Financial Results. Retrieved from ServiceNow IR. ServiceNow Investor Relations
GuruFocus News. (2025, October 30). ServiceNow Inc (NOW) Q3 2025 Earnings: EPS of $2.40 Beats Estimates. Retrieved from GuruFocus. GuruFocus