A growing number of professionals and behavioral economists are challenging the narrative: what if the real key to fulfillment isn’t how much you earn, but how you think about what you have?
This shift in perspective often referred to as a “wealth mindset reset” is gaining traction across industries, from finance to mental health. The premise is straightforward: when individuals focus less on income comparisons and more on positive drivers like stability, growth, and purpose, they tend to experience higher levels of satisfaction and long-term success.
The Problem with Income Obsession
For decades, income has been the most visible and measurable indicator of success. Promotions, bonuses, and salary benchmarks are easy to quantify. But that clarity comes with a downside.
“Constantly measuring yourself against others financially creates a moving target,” says one financial wellness expert. “There’s always someone earning more, which can lead to chronic dissatisfaction even when you’re objectively doing well.”
This phenomenon is closely tied to relative income theory, where happiness is influenced less by absolute earnings and more by how one stacks up against peers. The result? Even high earners can feel financially insecure.
Reframing Success
Instead of anchoring self-worth to income, experts recommend shifting focus toward controllable and meaningful metrics:
Financial Stability – Are your essential needs covered? Do you have a safety net?
Progress – Are you improving your skills, growing your career, or expanding your opportunities?
Autonomy – Do you have control over your time and decisions?
Purpose – Does your work align with your values or provide a sense of contribution?
These factors, while less tangible than a paycheck, have a stronger correlation with long-term well-being.
The Psychology of Positive Focus
Research in positive psychology suggests that gratitude and forward-looking thinking can significantly improve both mental health and productivity. When individuals focus on what’s working rather than what’s lacking they’re more likely to make better decisions, take calculated risks, and build sustainable habits.
In practical terms, this could mean recognizing consistent income instead of chasing sporadic spikes, or valuing flexibility in a job over a marginal salary increase.
A Financial Strategy Hidden in Plain Sight
Interestingly, this mindset isn’t just about feeling better it can also lead to smarter financial behavior.
People who aren’t fixated on income alone are more likely to:
Save consistently rather than spend to “keep up”
Invest with a long-term perspective
Avoid high-risk decisions driven by short-term gain
Build diversified income streams over time
In essence, focusing on positives creates a more disciplined and resilient financial strategy.
Real-World Application
Consider two individuals earning the same salary. One constantly compares themselves to higher earners, feels behind, and takes on unnecessary financial risks. The other focuses on steady growth, appreciates their progress, and makes calculated decisions.
Over time, the second individual is more likely to build sustainable wealth not necessarily because they earn more, but because they think differently.
In the End
Income will always matter it’s a fundamental part of financial security. But it’s not the full picture. By shifting attention away from “how much” and toward “how well,” individuals can unlock a more balanced, productive, and ultimately rewarding financial life.
In a world obsessed with numbers, the real advantage may belong to those who learn to look beyond them.
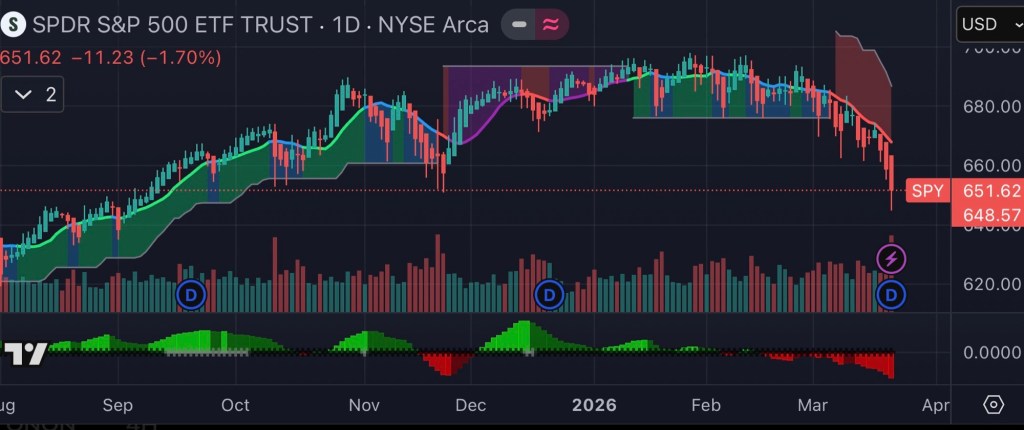
State Street SPDR S&P 500 ETF Trust (SPY) $648.57 -$11.81 (1.79%) • Today $653.51+$4.94 (0.76%) After Hours
By Industry Perspective
The relationship between financial strength and personal health is no longer theoretical, it’s measurable, observable, and, in many cases, predictable. Whether you’re analyzing the volatility of the market through vehicles like the SPDR S&P 500 ETF Trust or underwriting a homeowner’s policy, the same principle applies: risk management drives outcomes both financially and physically.
Market Volatility and Mental Health: The Silent Correlation
As illustrated in the market activity above, even broad-based investments can experience short-term declines. While seasoned investors understand this as normal market behavior, the psychological response is often anything but rational.
Periods of drawdown like recent fluctuations in the S&P 500 can trigger stress responses similar to those seen in high-risk professions. Elevated cortisol levels, poor sleep, and impulsive decision-making (panic selling, overtrading) are common. In financial terms, this is known as behavioral risk and it can erode long-term returns faster than market downturns themselves.
From a health standpoint, chronic stress is linked to:
Cardiovascular disease
Weakened immune response
Reduced cognitive performance
Translation: Poor financial discipline doesn’t just hurt your portfolio it can degrade your physical health.
Insurance: The Health Buffer You Don’t Think About
In the insurance industry, we view risk through a different but parallel lens. Policies aren’t just financial tools; they are health preservation mechanisms.
Consider this:
A homeowner without proper coverage facing a catastrophic loss (fire, hurricane, liability claim) doesn’t just experience financial strain it often leads to anxiety, depression, and long-term instability.
Conversely, a properly insured individual has risk transferred, which significantly reduces stress exposure.
This is especially relevant in markets like Florida, where environmental risk is high. Strategic coverage wind mitigation credits, flood insurance, liability umbrellas does more than protect assets. It protects peace of mind, which is directly tied to long-term health outcomes.
Wealth Building as a Health Strategy
There’s a growing body of thought especially among financial planners and risk professionals that wealth is a form of preventative medicine.
Here’s how:
Liquidity Reduces Stress Emergency funds and accessible capital eliminate the “fight-or-flight” response during crises.
Diversification Mirrors Healthy Living Just as a balanced diet prevents overexposure to one risk factor, diversified portfolios reduce systemic financial risk.
Long-Term Planning Promotes Stability Retirement accounts, life insurance, and asset protection strategies create predictability one of the most powerful contributors to mental well-being.
The Discipline Overlap: Investors vs. Insureds
The most successful individuals in both investing and insurance share identical behavioral traits:
Consistency over intensity (dollar-cost averaging vs. regular policy reviews)
Risk awareness without fear-based decisions
Long-term thinking over short-term reactions
This overlap is not coincidental it’s structural. Both disciplines reward those who understand that risk isn’t something to avoid it’s something to manage intelligently.
Final Analysis: Health and Wealth Are Not Separate Systems
The traditional view separates financial planning and personal health into different domains. That view is outdated.
Poor financial decisions → Increased stress → Negative health outcomes
Lack of protection (insurance gaps) → Catastrophic loss → Long-term instability
Bottom line: The same habits that build wealth discipline, planning, risk management are the exact habits that sustain long-term health.
Closing Thought
Whether you’re reviewing your investment portfolio or evaluating your insurance coverage, you’re not just making financial decisions you’re making lifestyle decisions that will compound over time.
Because in the end, the real ROI isn’t just measured in dollars… it’s measured in how well and how peacefully you live.
About the Author:
David Dandaneau is a client relations analyst that covers the insurance and financial services industry. He is known for his insightful analysis and comprehensive coverage of market trends and regulatory developments.
Your credit profile is more than a borrowing tool, it is a core risk-rating variable in property and casualty insurance. Before adjusting your homeowners or auto policy whether increasing limits, changing carriers, adding vehicles, or bundling coverage, it is strategically prudent to review your credit report. The impact can be material.
The Role of Credit in Insurance Underwriting
Most insurers use a credit-based insurance score when pricing home and auto policies. While distinct from a traditional FICO score, it is derived from similar data points contained in your credit report, payment history, outstanding balances, credit utilization, length of credit history, and types of accounts.
Insurers view credit behavior as a predictive indicator of claims frequency and severity. Statistically, lower insurance scores correlate with higher loss ratios. As a result, your credit profile can influence:
Premium pricing
Eligibility for preferred tiers
Qualification for discounts
Payment plan options
Even carrier acceptance in certain markets
If you are preparing to modify coverage such as raising dwelling limits, adding an umbrella policy, financing a new vehicle, or switching companies your credit profile may directly affect the quoted rate.
Why Timing Matters
Policy changes often trigger underwriting review. For example:
Switching carriers typically requires a fresh credit-based insurance score pull.
Adding a newly financed vehicle may prompt re-rating.
Rewriting a homeowners policy due to renovations can initiate updated underwriting.
If your credit report contains errors, late payments that were paid, accounts that are not yours, inflated balances, or identity discrepancies those inaccuracies can raise your insurance score risk tier and increase your premium unnecessarily.
Reviewing your credit report beforehand gives you an opportunity to correct discrepancies before they influence underwriting outcomes.
Common Credit Report Issues That Impact Insurance Rates
Consumers are frequently surprised at how minor inaccuracies affect pricing. Common issues include:
Incorrect delinquency reporting
Duplicate accounts
High reported credit utilization due to statement timing
Accounts that should reflect paid-in-full status
Fraudulent activity or identity theft
Correcting these errors before making policy changes can prevent avoidable premium increases.
Financial Planning Perspective
Insurance adjustments are often part of broader financial decisions buying a home, refinancing, purchasing a vehicle, consolidating debt, or upgrading property. In these scenarios, credit optimization creates compounding benefits:
Lower interest rates on loans
More favorable insurance premiums
Stronger negotiating leverage
Access to top-tier carriers
From a risk management standpoint, insurance is not just about coverage it is about capital efficiency. Paying more in premium due to preventable credit issues erodes financial optimization.
Strategic Steps Before Adjusting Coverage
Obtain a current copy of your credit report from all three major bureaus.
Review for inaccuracies, disputes, or outdated negative information.
Address any discrepancies prior to requesting quotes or making policy changes.
Consult with your insurance professional to understand how credit factors into your state’s rating structure.
It is important to note that some states restrict or limit the use of credit in insurance underwriting, but in most jurisdictions it remains a key rating component.
Long and Short
Before modifying your home or auto insurance policy, conduct a financial due diligence review of your credit report. In the insurance marketplace, pricing precision is data-driven. Ensuring that your credit file accurately reflects your financial behavior can protect you from overpaying and position you for optimal underwriting classification.
Insurance is a risk transfer mechanism but your credit profile is part of the risk equation. Reviewing it is not optional diligence; it is strategic financial management.
About the Author:
David Dandaneau is a client relations analyst that covers the insurance and financial services industry. He is known for his insightful analysis and comprehensive coverage of market trends and regulatory developments.
Two of the most common individual retirement savings vehicles… the Roth IRA and the Traditional IRA remain central to long-term financial planning. While both allow individuals to save for retirement with tax advantages, the way they work, eligibility requirements, and strategic benefits differ significantly. This article breaks down those differences using the most current IRS limits and rules for 2025 and 2026.
What Is an IRA?
An Individual Retirement Arrangement (IRA) is a personal retirement account that offers tax-advantaged growth. Both Traditional and Roth IRAs fall under this umbrella, and for both types, the total annual contribution limit is a combined figure meaning your contributions across all your IRAs cannot exceed the IRS annual cap. For 2025, this limit is $7,000 for savers under age 50 and $8,000 for those aged 50 or older. For 2026, the limits increase to $7,500 for those under 50 and $8,600 for those 50 and older.
Traditional IRA: Tax-Deferred Savings
A Traditional IRA’s most notable feature is tax-deferred growth. Contributions may be tax-deductible in the year made, reducing taxable income now, while earnings grow tax-deferred until withdrawal. Withdrawals after age 59½ are taxed as ordinary income.
Eligibility and Deductibility:
Anyone with taxable compensation can contribute to a Traditional IRA regardless of age, as long as they earn at least as much as the contribution.
Income limits affect deductibility, not the ability to contribute. If you (or your spouse) are covered by a workplace retirement plan, deductibility phases out at higher modified adjusted gross income (MAGI) ranges — for example, in 2026, deductibility phases out for joint filers between roughly $129,000 and $149,000, and for singles between roughly $81,000 and $91,000.
Required Minimum Distributions (RMDs): Account owners must begin taking RMDs starting at age 73, forcing taxable withdrawals even if they don’t need the funds.
Early Withdrawal Penalties: Withdrawals before age 59½ may incur a 10% penalty on top of ordinary income tax unless exceptions (e.g., first-time home purchase, qualified education expenses) apply.
Roth IRA: Tax-Free Growth and Withdrawal
A Roth IRA, in contrast, is funded with after-tax dollars, meaning contributions do not receive an upfront tax deduction. However, qualified withdrawals in retirement including earnings are tax-free if certain conditions are met, such as being at least age 59½ and holding the account for at least five years.
Eligibility and Income Limits:
Contributions are allowed at any age provided the taxpayer has taxable compensation and their MAGI falls below IRS limits.
For 2025, single filers with MAGI under $150,000 and joint filers under $236,000 are eligible for maximum contributions. Partial contributions are allowed up to a higher MAGI, and above $165,000 (single) or $246,000 (joint), no contribution is permitted.
In 2026, the MAGI thresholds increase slightly full eligibility for single filers under $153,000 and joint filers under $242,000, with contributions phasing out above those thresholds.
No RMDs: Unlike Traditional IRAs, Roth IRAs do not require the owner to take RMDs during their lifetime, allowing money to compound tax-free longer.
Withdrawal Rules: While contributions can be withdrawn at any time tax- and penalty-free, earnings are tax-free only if the distribution meets the qualified distribution rules (generally age 59½ and 5-year holding period). Withdrawals before these conditions may trigger taxes and penalties.
Strategic Opportunities and Planning Considerations
Tax Bracket Management:
A Traditional IRA may be appealing for individuals seeking to reduce taxable income now, especially if they expect to be in a lower tax bracket in retirement.
A Roth IRA, being tax-free at withdrawal, benefits those who expect their tax rate to be higher in retirement, or who want tax diversification.
Estate Planning: Because Roth IRAs do not require RMDs, they can be advantageous for estate planning, allowing funds to grow longer and potentially pass tax-free to heirs (though beneficiaries have their own distribution rules).
Combined Use: Many financial planners advocate holding both account types when feasible taking advantage of tax-deduction opportunities now while also securing future tax-free income diversification.
References
Internal Revenue Service. (2024). Publication 590-A (2025), Contributions to Individual Retirement Arrangements (IRAs). Retrieved from IRS.gov.
Internal Revenue Service. (2024). Traditional and Roth IRAs. Retrieved from IRS EITC website.
Fidelity Investments. (2026). Roth IRA contribution and income limits for 2025 and 2026. Retrieved from fidelity.com.
Fidelity Investments. (2025). Roth IRA income limits for 2025 and 2026. Retrieved from fidelity.com.
Fidelity Investments. (2026). IRA contribution limits for 2025 and 2026. Retrieved from fidelity.com.
Kiplinger. (2025). How to Calculate RMDs for IRAs. Retrieved from kiplinger.com.
Kiplinger. (2025). Traditional IRA Basics: 10 Things to Know to Build Wealth. Retrieved from kiplinger.com.
Financial experts consistently emphasize that couples who treat money as a shared responsibility rather than an individual burden are better positioned to build wealth, reduce stress, and achieve long-term stability.
Research and guidance from organizations like the Consumer Financial Protection Bureau and the Federal Reserve suggest that transparency, planning, and shared accountability are among the strongest predictors of financial success in households.
Why Teamwork Matters in Financial Management
Money represents more than numbers it reflects priorities, values, and long-term aspirations. When couples align financially, they can:
Plan effectively for major milestones like homeownership, retirement, or raising children
Conversely, when partners operate independently without coordination, misunderstandings and inefficiencies can arise, often slowing progress toward shared goals.
Practical Tips for Managing Money Together
1. Establish Complete Financial Transparency
Each partner should disclose income, debts, assets, and credit obligations. Full transparency builds trust and allows for accurate planning.
2. Define Shared Financial Goals
Successful couples identify both short-term and long-term objectives, such as:
Emergency fund targets
Vacation savings
Retirement timelines
Major purchases (home, vehicle, education)
When goals are mutual, financial decisions become easier and more purposeful.
3. Create a Joint Budget Strategy
Couples may choose from several structures:
Fully joint accounts
Separate accounts with shared expense contributions
Hybrid approach (joint bills account plus individual discretionary accounts)
There is no single correct model—the key is consistency and agreement.
4. Assign Financial Roles Based on Strengths
One partner may excel at budgeting while the other focuses on investing or bill management. Dividing responsibilities improves efficiency while maintaining shared oversight.
5. Schedule Regular Financial Check-Ins
Monthly or quarterly discussions help ensure progress, address concerns, and adjust plans as circumstances evolve.
The Psychological Advantage of Financial Partnership
Couples who work together financially often experience reduced stress and improved emotional security. Shared financial clarity reduces uncertainty, one of the most significant drivers of financial anxiety.
Financial partnership also creates resilience. Unexpected events such as job loss or medical expenses are easier to manage when supported by combined resources and coordinated planning.
Comparing Financial Advantages: Couples vs. Singles
Financial Factor
Benefits as a Couple
Benefits as Single
Income Potential
Combined income increases earning power and savings capacity
Full control over personal income decisions
Living Expenses
Shared housing, utilities, and insurance reduce per-person costs
No obligation to support another person financially
Risk Management
Dual income provides safety if one partner loses employment
Independent investment strategy without compromise
Financial Accountability
Mutual oversight reduces impulsive spending
Complete autonomy over financial decisions
Major Purchases
Easier qualification for mortgages and loans due to combined income
Simpler approval process based solely on individual credit
Financial Flexibility
Shared planning enables long-term stability and goal alignment
Greater freedom to relocate or change careers quickly
The Key to Success: Alignment, Not Perfection
Managing money as a couple does not require identical spending habits or financial philosophies. Instead, success depends on communication, mutual respect, and consistent planning.
Financial partnership is ultimately about alignment. Couples who approach money as a team rather than as individuals sharing expenses position themselves to build stronger financial foundations, navigate economic uncertainty, and achieve long-term goals more efficiently.
In an increasingly complex financial world, teamwork remains one of the most powerful wealth-building strategies available.
For many retirees, enrolling in Medicare feels straightforward—until they encounter IRMAA. The Income-Related Monthly Adjustment Amount (IRMAA) is a surcharge added to your Medicare Part B and Medicare Part D premiums if your income exceeds certain thresholds. While Medicare premiums are standardized for most beneficiaries, IRMAA introduces income-based pricing that can materially increase healthcare costs for higher earners.
Here is what you need to know.
What Is IRMAA?
IRMAA stands for Income-Related Monthly Adjustment Amount. It is not a separate policy or optional coverage it is an additional premium surcharge applied to:
Medicare Part B (medical insurance)
Medicare Part D (prescription drug coverage)
The surcharge is determined by the Social Security Administration (SSA) using your Modified Adjusted Gross Income (MAGI) from two years prior. For example, your 2026 premiums are generally based on your 2024 tax return.
How Income Affects Your Medicare Premiums
IRMAA applies once your income crosses specific annual thresholds. These thresholds are tiered. The higher your income, the higher your surcharge.
Key factors include:
Filing status (single vs. married filing jointly)
MAGI (Adjusted Gross Income + tax-exempt interest)
Two-year lookback period
This means a one-time spike in income such as selling a business, converting a large IRA to a Roth, or realizing significant capital gains can temporarily increase your Medicare premiums two years later.
How Much Can IRMAA Increase Your Costs?
While standard Part B and Part D premiums are set annually, IRMAA can substantially increase your total healthcare expenses.
The surcharge:
Increases Part B monthly premiums incrementally based on income tier.
Adds an additional amount to your Part D premium, paid directly to Medicare (separate from your plan’s base premium).
For higher-income retirees, IRMAA can add several thousand dollars per year in additional premiums.
Common Triggers for IRMAA
Many retirees are surprised by IRMAA because the income event occurred years earlier. Common triggers include:
Large Required Minimum Distributions (RMDs)
Roth IRA conversions
Sale of appreciated assets
Business sale or deferred compensation payouts
Real estate transactions
Capital gains from portfolio rebalancing
Strategic income planning can help mitigate these impacts.
Can You Appeal IRMAA?
Yes. If your income has decreased due to a qualifying life event, you can request a reassessment from the SSA.
Qualifying life-changing events include:
Retirement or reduction in work hours
Divorce or death of a spouse
Loss of income-producing property
Employer settlement payment
You must file Form SSA-44 to request a reduction.
Planning Strategies to Manage IRMAA
Because IRMAA is tied to taxable income, proactive tax planning is essential. Strategies may include:
Managing the timing of Roth conversions
Coordinating capital gains realization
Strategic withdrawal sequencing from retirement accounts
Utilizing tax-efficient investment vehicles
Charitable giving strategies such as Qualified Charitable Distributions (QCDs)
For retirees with sizable portfolios, IRMAA becomes part of broader retirement income engineering not just healthcare planning.
Lastly
IRMAA is effectively a means-tested premium adjustment built into Medicare. It is not a penalty, but it can feel like one if you are unprepared.
Understanding how your income today affects your Medicare premiums two years from now is critical. With thoughtful planning, retirees can reduce surprises and potentially minimize unnecessary surcharges.
As healthcare costs continue to rise, integrating Medicare premium planning into your tax and retirement strategy is no longer optional… it is prudent financial management.
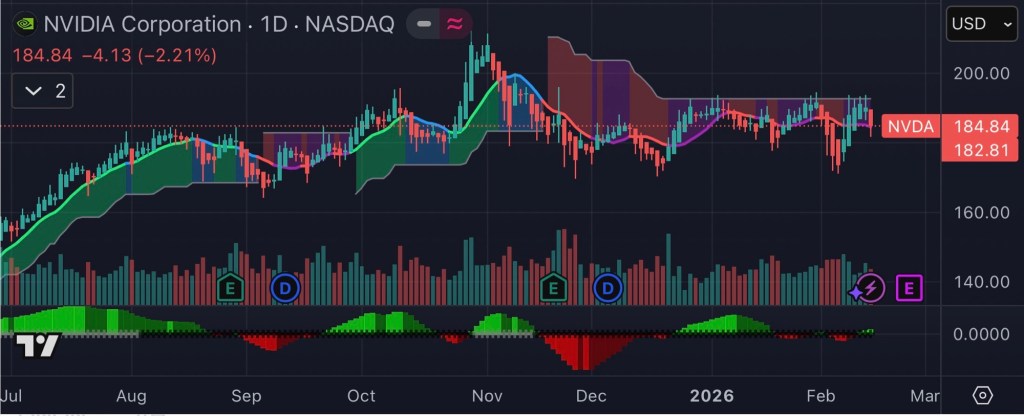
Despite recent volatility and short-term investor hesitation, NVIDIA (NASDAQ: NVDA) remains one of the strongest long-term investment opportunities in the global equity market. While the stock has experienced periods of consolidation and suppressed price action relative to its explosive growth, its financial performance, industry dominance, and forward cash flow trajectory suggest that current levels could represent a compelling entry point for long-term investors.
NVIDIA’s Financial Strength Remains Unmatched
NVIDIA’s growth over the past two years has been historic. The company reported $130.5 billion in fiscal 2025 revenue, up 114% year-over-year, along with net income of $72.9 billion, demonstrating extraordinary profitability.
This growth has accelerated further into fiscal 2026:
Q3 FY2026 revenue reached $57.0 billion, up 62% year-over-year.
Quarterly net income surged to $31.9 billion, representing exceptional margin strength.
NVIDIA expects continued momentum, projecting approximately $54 billion in quarterly revenue, indicating sustained demand.
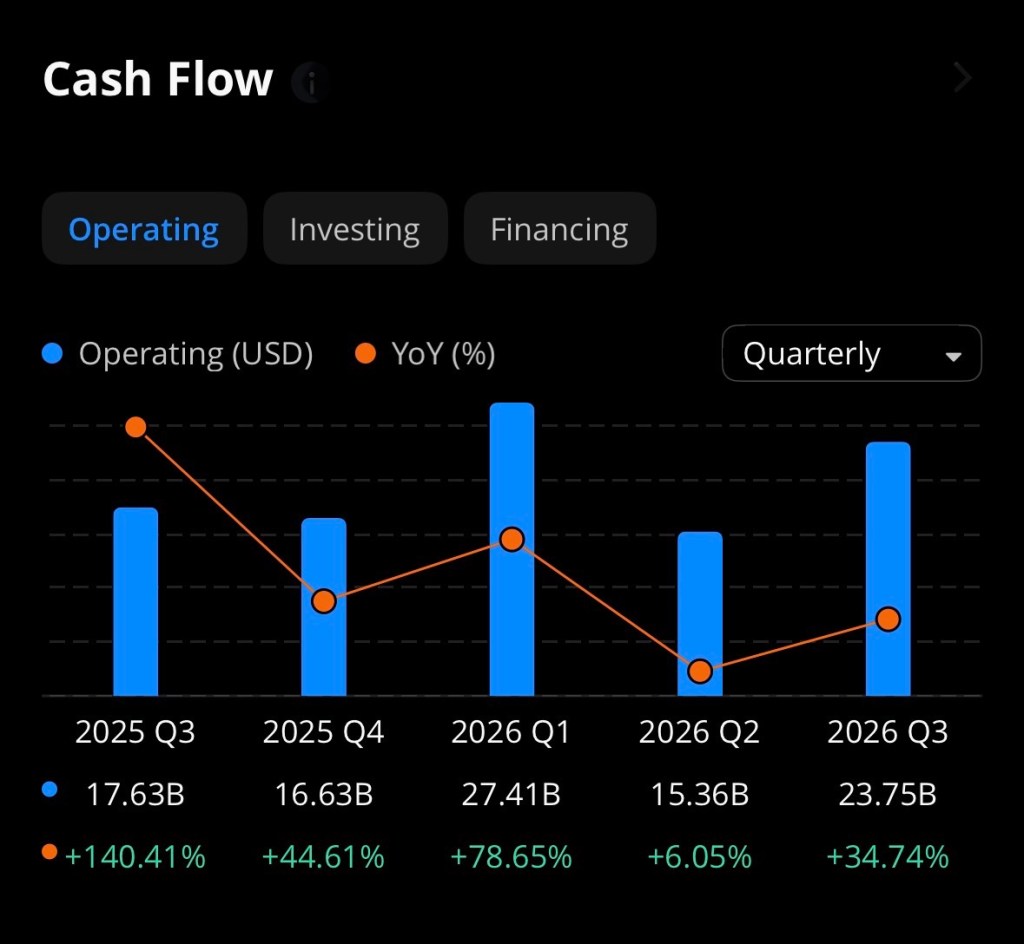
This performance translates directly into massive operating cash flow potential. With operating margins above 60% in recent quarters and explosive AI-related demand, NVIDIA is converting an unusually high percentage of revenue into free cash flow.
AI Demand Is Still in Its Early Stages
The most critical investment thesis for NVIDIA is its central role in powering artificial intelligence infrastructure globally.
Major technology companies are expected to spend over $650 billion on AI infrastructure in 2026, benefiting NVIDIA directly as the primary supplier of advanced GPUs.
Additionally:
NVIDIA’s data center segment generated over $51 billion in quarterly revenue, driven primarily by AI demand.
Analysts project NVIDIA’s data center revenue alone could reach $300 billion annually by fiscal 2027, reflecting extraordinary long-term growth potential.
This positions NVIDIA not simply as a semiconductor company, but as the foundational infrastructure provider for the global AI economy.
Why the Stock Appears “Suppressed” Despite Strong Fundamentals
NVIDIA’s stock consolidation is primarily driven by macro and investor psychology not deteriorating fundamentals.
Key factors include:
1. Massive Prior Gains Created Consolidation Period
After rising over 1,000% in recent years, periods of sideways movement are normal as valuation multiples normalize.
2. Investor Concerns About AI Spending Sustainability
Some investors worry large capital expenditures from tech giants could reduce near-term cash flow.
However, these investments are directly fueling NVIDIA’s revenue growth.
3. Emerging Competition
Companies like AMD, Broadcom, and custom chips from hyperscalers are increasing competition, but NVIDIA maintains a dominant performance and software ecosystem advantage.
Estimated Cash Flow Comparison: NVIDIA vs Competitors (2026 Projection)
Based on revenue guidance, historical free cash flow margins, and analyst projections, NVIDIA is expected to dramatically outperform competitors in absolute cash flow generation.
Company
Estimated 2026 Revenue
Estimated FCF Margin
Estimated 2026 Free Cash Flow
AI Market Position
NVIDIA
$240B–$280B
45%–55%
$110B–$150B
Dominant leader
AMD
$45B–$60B
20%–25%
$9B–$15B
Strong competitor
Broadcom
$65B–$75B
35%–40%
$23B–$30B
Growing AI custom chips
Intel
$55B–$65B
10%–20%
$6B–$12B
Recovery phase
Qualcomm
$42B–$48B
25%–30%
$11B–$14B
Mobile AI niche
Methodology: Estimates derived from:
Company financial statements
Forward guidance
Historical free cash flow conversion ratios
AI growth projections
Competitive Advantage: NVIDIA’s True Moat Is Software, Not Just Chips
NVIDIA’s competitive edge extends beyond hardware into software ecosystems such as CUDA, which creates lock-in effects across millions of developers.
Additionally:
NVIDIA’s GPUs remain superior for training large AI models.
The company continues rapid innovation with new Blackwell and next-generation AI architectures.
This creates extremely high switching costs for customers.
If NVIDIA generates $130 billion in annual free cash flow within the next 2–3 years, even a conservative valuation multiple of 30x FCF would imply:
Potential future valuation:
$130B × 30 = $3.9 trillion market cap
Compared to today’s lower valuation levels, this represents substantial upside potential.
Long-Term Investment Thesis: Why NVIDIA Remains a Buy
Key bullish factors:
1. AI Demand Is Still in Early Stages Global AI adoption is accelerating, not slowing.
2. Massive Free Cash Flow Generation Few companies in history have generated cash flow at NVIDIA’s scale.
3. Dominant Market Position NVIDIA remains the undisputed leader in AI computing infrastructure.
4. Strong Shareholder Returns The company has already returned $37 billion to shareholders through buybacks and dividends in FY2026 alone.
5. Long-Term Secular Tailwind AI is expected to reshape every industry over the next decade.
Risks Investors Should Monitor
No investment is risk-free. Key risks include:
Increased competition from AMD, Broadcom, and hyperscalers
Government export restrictions
Potential slowdown in hyperscaler spending
Valuation volatility due to macroeconomic conditions
However, none of these risks currently undermine NVIDIA’s dominant position.
Conclusion: Suppressed Prices May Represent a Rare Opportunity
NVIDIA remains one of the most financially powerful and strategically positioned companies in the world. Despite short-term stock volatility, its explosive revenue growth, dominant AI position, and unprecedented free cash flow generation suggest that current price consolidation may represent one of the most attractive long-term entry opportunities available.
For investors with a multi-year horizon, NVIDIA remains a cornerstone asset in the AI-driven future economy.
Disclosure: The author does not currently own, directly or indirectly, any shares, options, or other financial interests in NVIDIA Corporation (NASDAQ: NVDA) at the time of publication. This article is provided for informational and educational purposes only and does not constitute financial, investment, or trading advice. Investors should conduct their own research and consult with a licensed financial professional before making any investment decisions.
References
Barron’s. (2026, February). Nvidia stock rises. Broadcom is closing the AI chips gap. Retrieved from https://www.barrons.com
Barron’s. (2026, February). Nvidia stock pops. It should benefit from OpenAI spending. Retrieved from https://www.barrons.com
MarketWatch. (2026, February). Microsoft’s stock is cheaper than IBM’s for the first time in a decade. Retrieved from https://www.marketwatch.com
NVIDIA Corporation. (2025). NVIDIA announces financial results for fourth quarter and fiscal 2025. Retrieved from https://nvidianews.nvidia.com
NVIDIA Corporation. (2025). NVIDIA announces financial results for second quarter fiscal 2026. Retrieved from https://nvidianews.nvidia.com
NVIDIA Corporation. (2025). NVIDIA announces financial results for third quarter fiscal 2026. Retrieved from https://nvidianews.nvidia.com
NVIDIA Corporation. (2025). NVIDIA announces financial results for first quarter fiscal 2026. Retrieved from https://nvidianews.nvidia.com
Tom’s Hardware. (2025, December). Nvidia’s revenue skyrockets to record $57 billion per quarter. Retrieved from https://www.tomshardware.com
For individuals entering the investment world, the sheer volume of choices like individual stocks, bonds, options, commodities, and more can feel overwhelming. Exchange-Traded Funds, commonly known as ETFs, have emerged as one of the most practical and efficient starting points for new investors. By combining diversification, accessibility, and flexibility, ETFs offer exposure to broad segments of the market while minimizing many of the risks associated with selecting individual securities.
Yet while ETFs are powerful tools, they are not a cure-all. Understanding both their capabilities and limitations is essential before incorporating them into a long-term investment strategy.
What Is an ETF?
An Exchange-Traded Fund is a pooled investment vehicle that trades on a stock exchange, much like an individual stock. Each ETF holds a basket of underlying assets such as stocks, bonds, commodities, or other securities. When you purchase one share of an ETF, you are effectively purchasing partial ownership in all the assets within that fund.
For example:
An S&P 500 ETF provides exposure to 500 of the largest U.S. companies.
A bond ETF provides exposure to government or corporate debt.
A sector ETF might focus solely on technology, healthcare, or energy.
This structure allows investors to diversify their portfolio instantly with a single transaction.
Why ETFs Are an Ideal Starting Point for Beginners
1. Instant Diversification
One of the biggest risks new investors face is concentration risk putting too much money into a single stock. ETFs mitigate this by spreading investments across dozens, hundreds, or even thousands of securities.
Instead of betting on one company, you can invest in an entire market segment.
2. Lower Costs Compared to Mutual Funds
Most ETFs are passively managed, meaning they track an index rather than relying on expensive active management. As a result, expense ratios are typically very low—often under 0.10% annually.
Lower fees translate into higher long-term returns, as fees compound negatively over time.
3. Ease of Trading
ETFs trade throughout the day on stock exchanges, just like individual stocks. Investors can buy or sell at any time during market hours, providing flexibility and liquidity.
4. Transparency
Most ETFs disclose their holdings daily, allowing investors to see exactly what they own. This transparency helps investors make informed decisions.
5. Accessibility
Many brokerage platforms allow investors to purchase ETFs with no commissions and relatively small amounts of capital.
Chart: Trade Opportunities Available Through ETFs
Trade Opportunity
ETF Example Type
Risk Level
Potential Reward
Best For
Broad Market Exposure
S&P 500 ETF
Moderate
Steady long-term growth
Beginners, retirement investors
Sector Investing
Technology or Healthcare ETF
Moderate-High
Higher growth potential
Investors targeting specific industries
Dividend Income
Dividend ETF
Low-Moderate
Passive income + growth
Income-focused investors
Bond Exposure
Treasury or Corporate Bond ETF
Low
Stability and income
Conservative investors
International Markets
Emerging Markets ETF
High
High growth potential
Diversification seekers
Commodity Exposure
Gold or Oil ETF
High
Inflation hedge
Advanced diversification
Thematic Investing
AI, Clean Energy ETF
High
Significant upside potential
Growth-oriented investors
Defensive Investing
Consumer Staples ETF
Low-Moderate
Stability during downturns
Risk-averse investors
What ETFs Can Do for You
Provide Diversification Efficiently
ETFs allow investors to spread risk across multiple companies and sectors without needing large amounts of capital.
Reduce Emotional Decision-Making
Instead of worrying about individual company performance, ETFs allow investors to focus on broader economic trends.
Build a Strong Long-Term Foundation
Many retirement portfolios are built primarily using broad-market ETFs due to their consistency and reliability.
Offer Exposure to Specialized Markets
ETFs make it possible to invest in areas that would otherwise be difficult to access, such as foreign markets, commodities, or niche sectors.
What ETFs Cannot Do for You
Guarantee Profits
ETFs follow the market. If the overall market declines, ETFs will decline as well.
Eliminate Risk
While diversification reduces risk, it does not eliminate it. Market downturns affect most ETFs.
Outperform the Market Consistently
Most ETFs are designed to match market performance, not exceed it.
Protect Against Poor Investment Timing
Buying during market highs can still lead to temporary losses, even with diversified ETFs.
ETFs vs Individual Stocks: Risk Comparison
Feature
ETFs
Individual Stocks
Diversification
High
Low
Risk Level
Moderate
High
Volatility
Lower
Higher
Research Required
Moderate
High
Potential Reward
Moderate-High
High
Loss Potential
Reduced
Significant
Why Many Professionals Recommend ETFs First
Warren Buffett, one of the most successful investors in history, has repeatedly recommended low-cost index ETFs for most investors. His reasoning is simple: consistently beating the market is extremely difficult, even for professionals.
ETFs allow investors to participate in overall economic growth without needing to predict which individual companies will succeed.
The Bottom Line
Exchange-Traded Funds represent one of the most efficient and accessible tools available to new investors. They offer instant diversification, low costs, transparency, and flexibility—making them an ideal starting point for building wealth.
However, investors must understand that ETFs are not risk-free. They reflect the performance of the underlying markets, meaning patience, discipline, and long-term thinking remain essential.
For those beginning their investment journey, ETFs provide something invaluable: a balanced and intelligent way to participate in the market while learning and growing as an investor.
Over time, they can serve not just as a starting point but as the foundation of a successful financial future.
References
Buffett, W. E. (2017). The essays of Warren Buffett: Lessons for corporate America (5th ed.). Carolina Academic Press.
Investment Company Institute. (2024). 2024 investment company fact book. https://www.ici.org
Morningstar, Inc. (2025). ETF investing guide: Understanding exchange-traded funds. https://www.morningstar.com
Securities and Exchange Commission. (2023). Exchange-traded funds (ETFs). U.S. Securities and Exchange Commission. https://www.sec.gov
U.S. Securities and Exchange Commission. (2024). Beginner’s guide to asset allocation, diversification, and rebalancing. https://www.investor.gov
Vanguard Group. (2024). Understanding ETFs: Benefits and risks. Vanguard. https://www.vanguard.com
BlackRock. (2025). ETF basics: What is an ETF? iShares by BlackRock. https://www.ishares.com
For much of the past decade, bonds were viewed primarily as a defensive allocation useful for dampening volatility, but rarely exciting. With historically low yields following the Global Financial Crisis and through the pandemic era, investors increasingly turned toward equities for meaningful returns while bonds played a passive role as a stabilizer.
That narrative is now changing. Bonds are once again emerging not only as a ballast for portfolios but as a legitimate source of income, total return potential, and tactical opportunity particularly for investors who understand how to position themselves across the yield curve.
The Great Reset: Higher Yields Have Changed the Equation
The most important development driving renewed interest in bonds is simple: yields are materially higher than they were just a few years ago.
Following aggressive Federal Reserve rate hikes between 2022 and 2024 to combat inflation, interest rates across maturities reset to levels not seen in over 15 years. As a result:
Short-term U.S. Treasury yields have hovered between 4.0% and 5.0%
Intermediate-term Treasuries offer yields in the 3.8% to 4.5% range
Investment-grade corporate bonds often yield 4.5% to 6.0%
Select high-quality municipal bonds provide tax-equivalent yields exceeding 6% for high-income investors
This shift represents a structural change. Investors can now generate meaningful income from bonds without assuming excessive credit risk or volatility.
For retirees, income-focused investors, and balanced portfolio managers, this is a significant opportunity.
Understanding the Yield Curve: Opportunity Lies in Positioning
The yield curve which plots interest rates across different maturities has been unusually dynamic in recent years. In some periods, shorter-term bonds have yielded more than longer-term bonds, creating what is known as an inverted yield curve, often associated with economic transitions.
This environment creates multiple strategic options.
Short-Term Bonds: High Income, Low Duration Risk
Short-term bonds (1–3 years maturity) currently offer attractive yields with minimal sensitivity to interest rate changes. This makes them ideal for:
Conservative investors
Cash alternatives
Capital preservation with income
They provide flexibility, allowing investors to reinvest at higher rates if yields rise further.
Intermediate-Term Bonds: The “Sweet Spot”
Many professional portfolio managers consider the intermediate portion of the yield curve (3–7 years) to offer the best balance of income and risk.
These bonds:
Provide strong yields
Offer moderate duration exposure
Stand to benefit if interest rates decline in the future
If rates fall, intermediate bonds may appreciate in price, delivering both income and capital gains.
Long-Term Bonds: Strategic Opportunity for Rate Declines
Long-duration bonds (10+ years) are more sensitive to interest rate movements but offer significant upside potential if interest rates decline.
When rates fall:
Bond prices rise
Longer-duration bonds rise more dramatically
This creates potential total return opportunities beyond income alone.
Bonds Are Once Again Competing with Stocks
One of the most important implications of higher yields is that bonds are now competitive with equities from an income perspective.
Consider this comparison:
S&P 500 dividend yield: approximately 1.5%
Investment-grade bonds: 4.5% to 6.0% yield
Treasury bonds: 3.8% to 4.5% yield
For the first time in many years, bonds offer substantially higher income with lower volatility.
This improves the risk-return tradeoff of balanced portfolios.
Portfolio Implications: A Strategic Shift Back Toward Fixed Income
Financial professionals increasingly recommend a renewed allocation to bonds—not just for safety, but for income generation and opportunity capture.
Thoughtful positioning across maturities can provide three simultaneous benefits:
1. Reliable Income Stream
Higher yields allow investors to generate consistent income without relying solely on dividends or equity appreciation.
2. Capital Appreciation Potential
If interest rates decline in the next 12–36 months, as many economists expect bond prices may rise, providing total return potential.
3. Risk Diversification
Bonds help reduce portfolio volatility and provide protection during equity market downturns.
Recommended Portfolio Framework: Laddered and Diversified
Rather than concentrating exposure in a single maturity, many advisors recommend a laddered bond strategy, which distributes investments across multiple maturities.
A sample framework may include:
30% Short-Term Bonds (1–3 years) Provides stability and reinvestment flexibility
40% Intermediate-Term Bonds (3–7 years) Offers strong income and balanced rate sensitivity
20% Long-Term Bonds (7–20 years) Positions portfolio for capital appreciation if rates decline
10% Opportunistic Credit (Investment-grade corporates or municipals) Enhances yield without excessive risk
This structure balances income, stability, and growth potential.
The Role of Bonds in 2026 and Beyond
The bond market is no longer an afterthought. It has returned to its traditional role as both a defensive and offensive component of a well-constructed portfolio.
Investors who actively position across the yield curve can benefit from:
Elevated income levels
Potential capital gains from future rate declines
Improved diversification and portfolio stability
After years of offering limited returns, bonds are once again doing what they were always meant to do: generate income, preserve capital, and create opportunity.
For disciplined investors, this is not merely a defensive allocation… it is a strategic advantage.
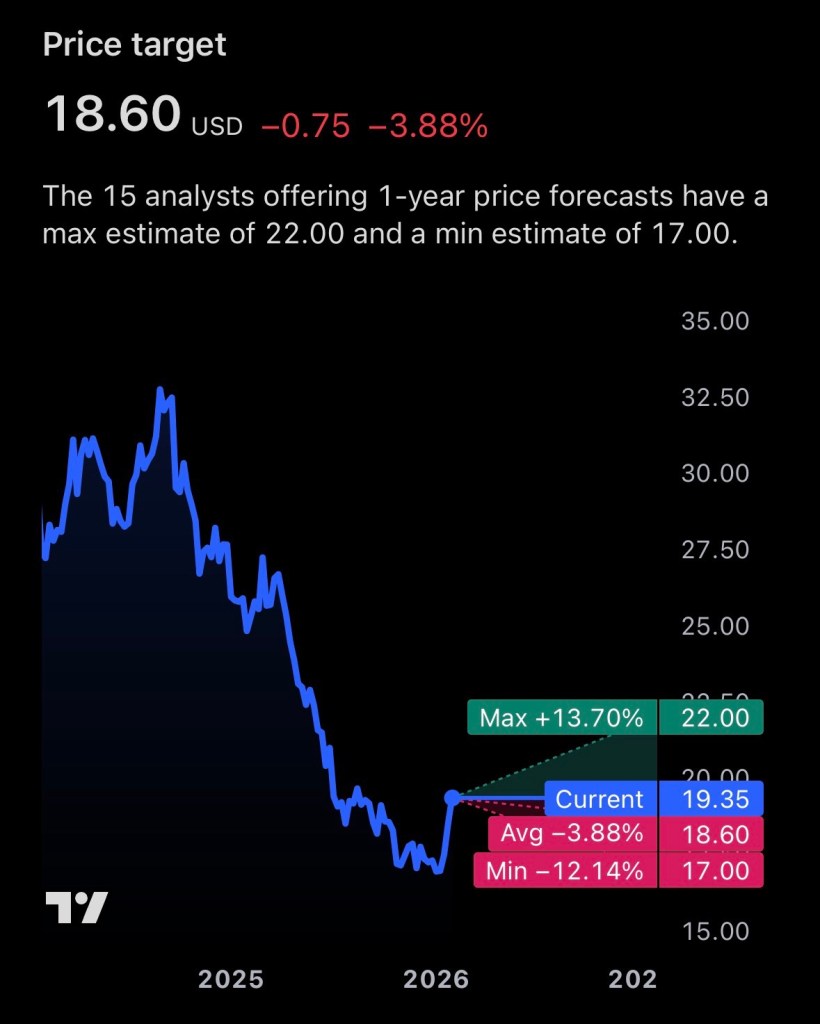
Conagra Brands, Inc. (NYSE: CAG), one of America’s largest packaged food companies and owner of iconic brands such as Birds Eye, Slim Jim, Healthy Choice, and Marie Callender’s, has emerged as a compelling investment candidate for income-focused investors. Despite recent operational challenges and declining share price performance, the company’s unusually high dividend yield, stable cash flows, and historically low valuation may present an attractive risk-reward profile for long-term investors willing to tolerate near-term volatility.
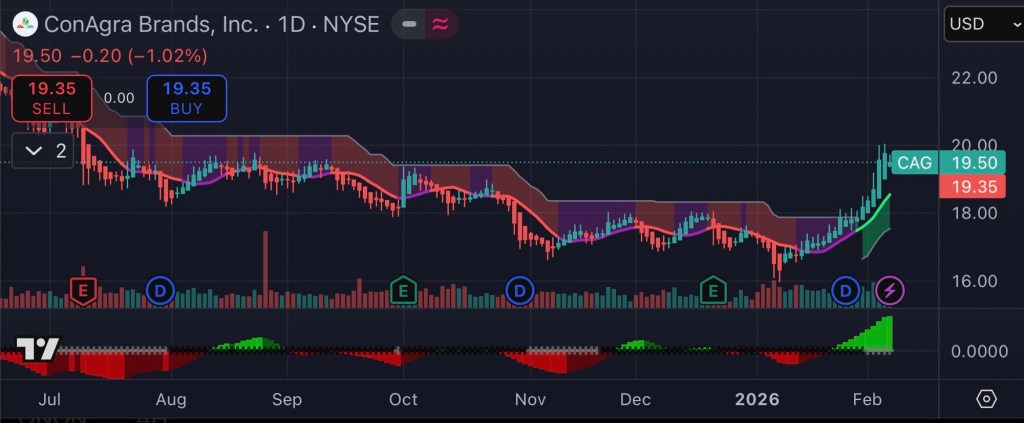
Current Stock Price and Market Position
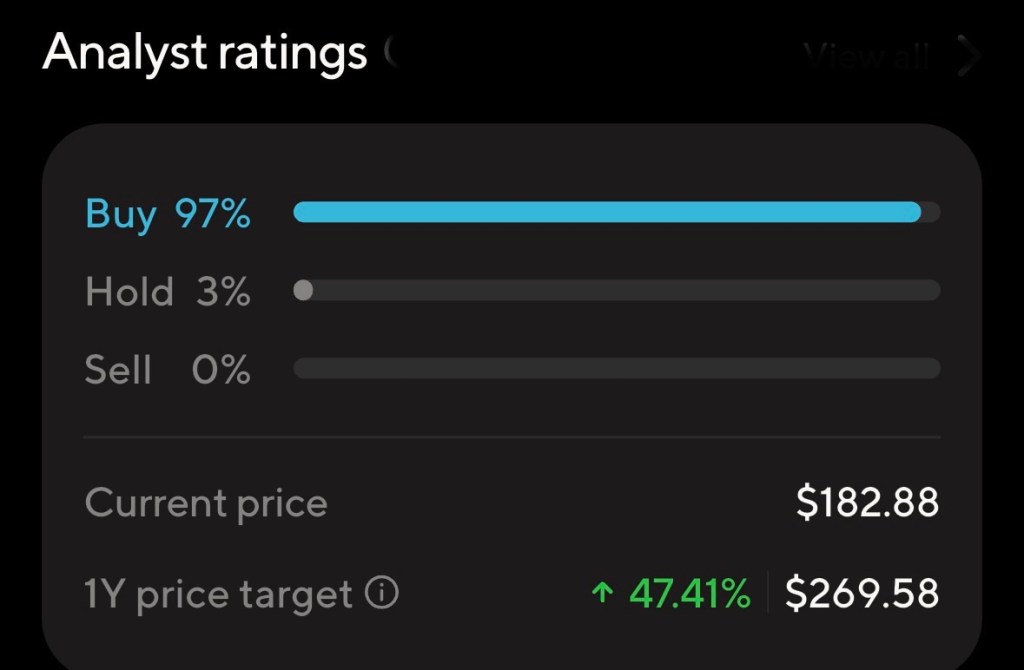
As of early February 2026, Conagra Brands shares are trading at approximately $19.55 per share, near the lower end of their 52-week range of $15.96 to $28.52. The company currently carries a market capitalization of roughly $8.8–$8.9 billion and generates annual revenue of approximately $11.23 billion, underscoring its significant presence in the consumer staples sector.
However, the stock has declined more than 26% over the past year, reflecting investor concerns about declining sales volume, rising costs, and shifting consumer preferences.
While these headwinds have weighed on investor sentiment, they have also created a rare combination of depressed valuation and elevated income potential.
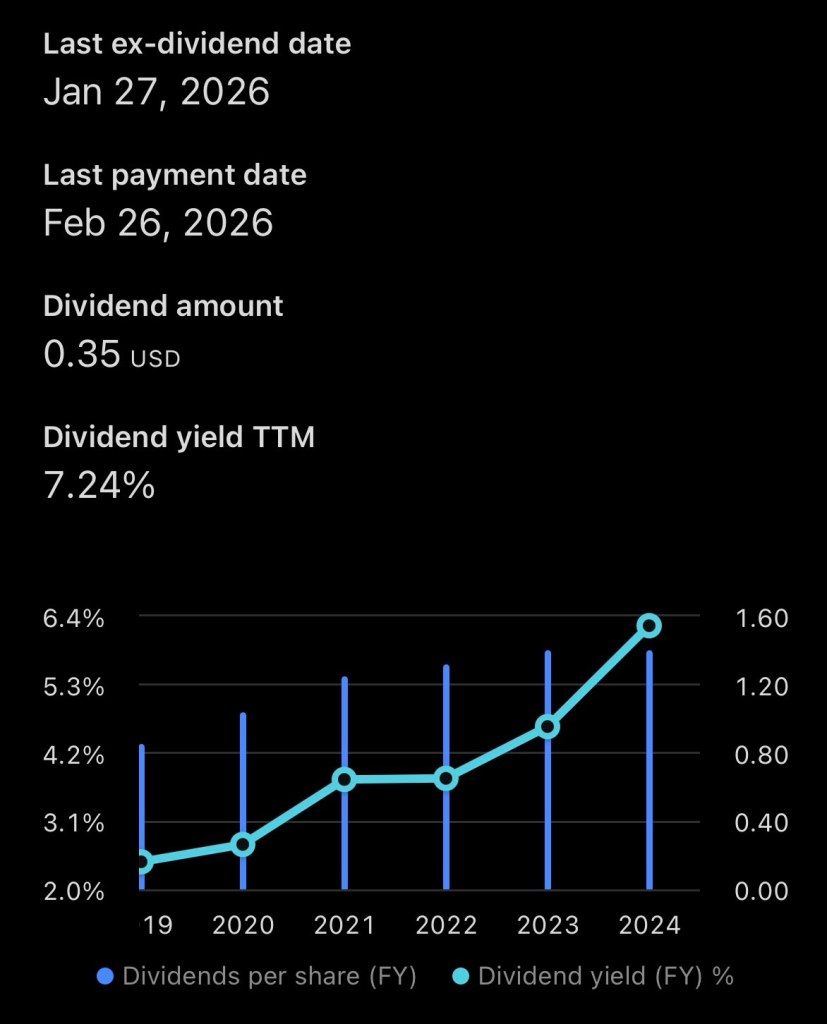
Dividend Yield: A Major Strength for Income Investors
Conagra Brands’ most compelling investment characteristic is its dividend.
Annual dividend: $1.40 per share
Dividend yield: Approximately 7.16% to 7.89% depending on price fluctuations
Dividend payout frequency: Quarterly
Dividend history: Over 160 dividend payments since 1985
This yield is significantly higher than the broader S&P 500 average, which typically ranges between 1.5% and 2.0%.
Even more importantly, Conagra generates strong free cash flow—approximately $1.14 billion annually—which supports its dividend payments and enhances their sustainability.
The company’s dividend payout ratio based on forward estimates ranges between 45% and 59% of cash flow, indicating the dividend is supported by underlying earnings power rather than excessive borrowing.
For investors seeking income, this dividend alone provides substantial annual returns regardless of stock price appreciation.
One of the most compelling reasons investors may consider Conagra today is its relatively low valuation.
Key valuation metrics include:
Forward price-to-earnings ratio: Approximately 10.4
Free cash flow yield: 13.4%
Book value per share: $18.64 (close to current share price)
These metrics suggest the stock is trading near its intrinsic asset value, with investors effectively paying a modest premium for a business that generates over $1 billion annually in free cash flow.
Historically, consumer staples companies trade at higher multiples due to their predictable cash flows and defensive characteristics. A forward P/E ratio near 10 places Conagra at a meaningful discount compared to many peers.
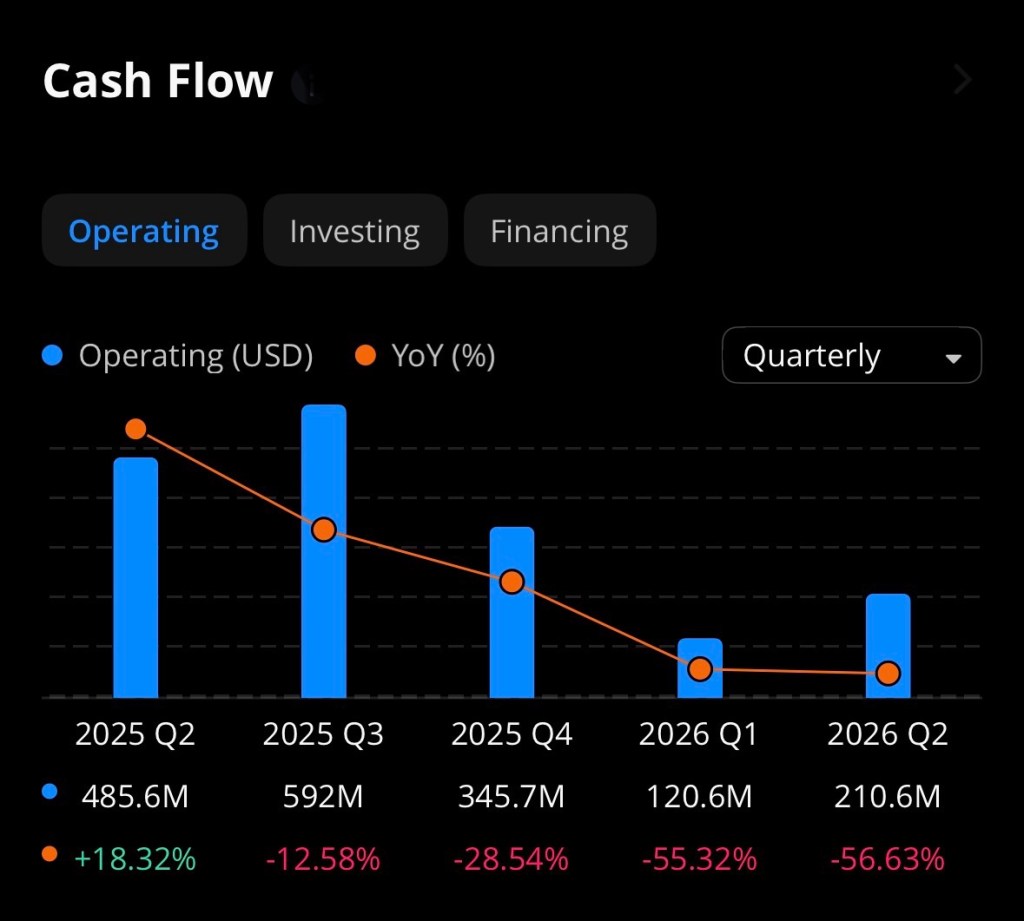
Cash Flow and Financial Strength Support Long-Term Stability
Despite near-term earnings pressures, Conagra remains fundamentally profitable and cash-generating.
Financial highlights include:
Operating cash flow: $1.54 billion annually
Free cash flow: $1.14 billion annually
Gross margin: 25.5%
Operating margin: 13.83%
These metrics demonstrate that even in a challenging economic environment, Conagra continues to generate meaningful profit margins.
Consumer staples companies like Conagra also tend to be more resilient during economic downturns, as demand for packaged food remains relatively stable regardless of broader economic conditions.
Recent Challenges Have Created Opportunity
Recent operational challenges have contributed to the stock’s decline, including:
Volume declines due to inflation-sensitive consumers
Rising raw material costs, particularly meat prices
Impairment charges and slower growth expectations
However, these challenges appear cyclical rather than structural.
Importantly, Conagra has reaffirmed its long-term outlook and continues investing in efficiency improvements, pricing strategies, and portfolio optimization.
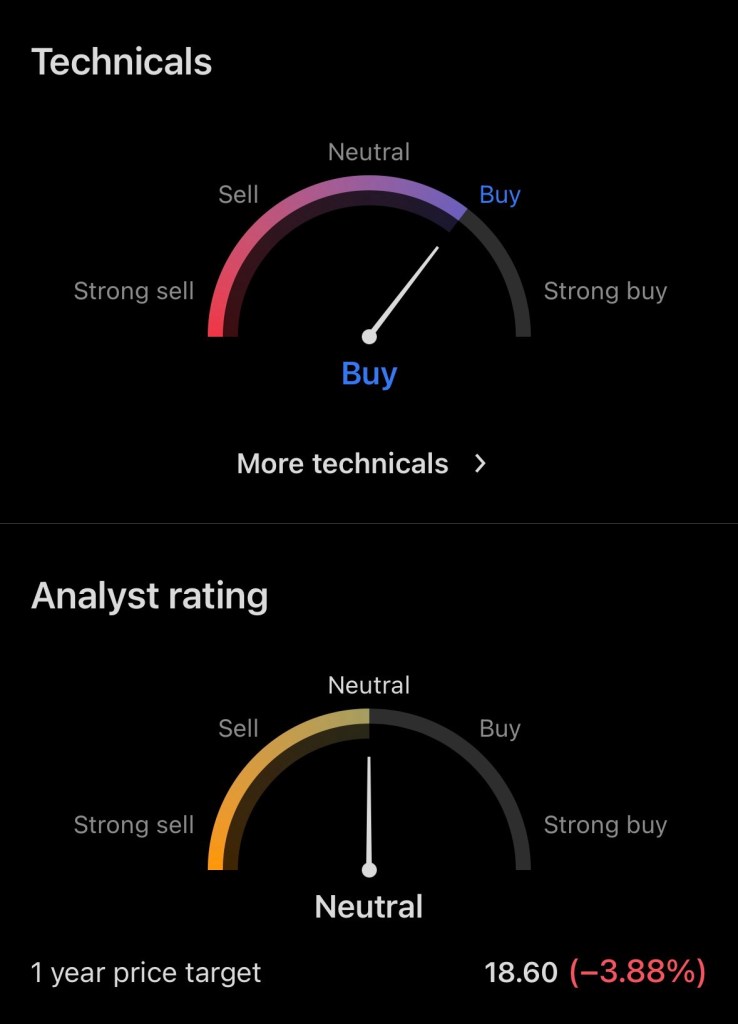
Analyst Price Target and Future Outlook
Wall Street analysts currently maintain an average price target of approximately $20.58, representing potential upside of about 16% from current levels.
Even more conservative targets suggest modest appreciation potential, while income investors collect a substantial dividend while waiting.
Reasonable 12-Month Price Projection
Based on:
Historical valuation multiples
Dividend yield normalization
Improving cost pressures
Stable consumer demand
A realistic one-year price range for Conagra Brands is:
Base Case: $20–$23 Bull Case: $24–$26 Bear Case: $17–$19
In addition to capital appreciation, investors could receive approximately 7% annual income, significantly enhancing total returns.
Total Return Potential: Combining Dividend and Price Recovery
If shares rise from $19.55 to $22.50 over the next year:
Capital gain: ~15%
Dividend yield: ~7%
Total return potential: ~22%
This level of total return potential is unusually high for a defensive consumer staples company.
Why Conagra Brands May Be a Strong Investment Choice
Key investment strengths include:
1. Exceptionally High Dividend Yield Nearly 7–8%, far above market averages.
3. Low Valuation Relative to Cash Flow and Assets Forward P/E near 10 suggests undervaluation.
4. Defensive Industry Position Food companies benefit from consistent consumer demand.
5. Potential Price Recovery as Conditions Improve Even modest improvement could drive meaningful upside.
Investment Risks
Despite its strengths, investors should consider potential risks:
High debt levels (~$8.28 billion)
Slowing revenue growth
Inflation and commodity cost pressures
Changing consumer dietary preferences
These risks explain the stock’s depressed valuation but also contribute to its opportunity.
Conclusion: Attractive Income Play with Recovery Potential
Conagra Brands represents a classic high-yield, undervalued income stock. While recent operational challenges have pushed shares lower, the company continues generating strong cash flow and paying a highly attractive dividend.
For income-focused investors and those seeking undervalued defensive stocks, Conagra offers:
Strong income potential
Possible capital appreciation
Defensive consumer staples exposure
If operational performance stabilizes and investor sentiment improves, Conagra Brands could deliver both income and moderate capital gains over the coming year.
Disclosure
The author currently holds a position in Conagra Brands (CAG). This article is for informational purposes only and should not be considered financial advice. Investors should conduct their own research or consult a financial advisor before making investment decisions.