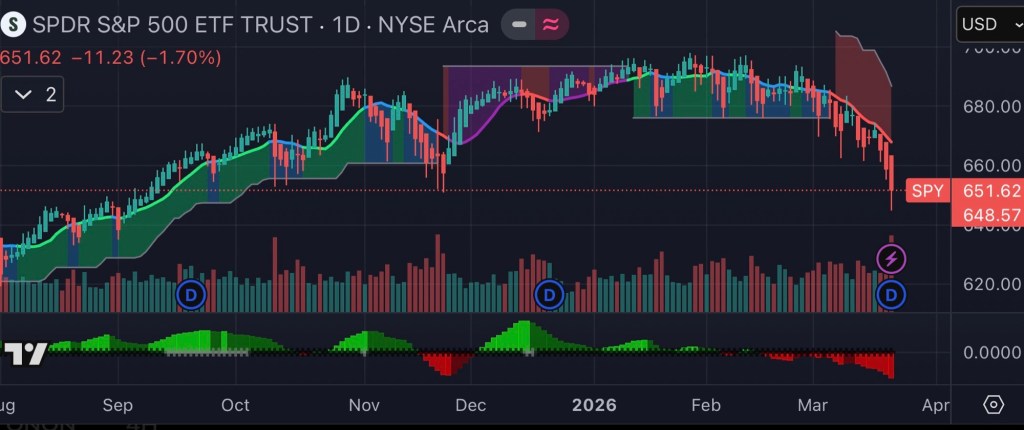
State Street SPDR S&P 500 ETF Trust (SPY) $648.57 -$11.81 (1.79%) • Today $653.51+$4.94 (0.76%) After Hours
By Industry Perspective
The relationship between financial strength and personal health is no longer theoretical, it’s measurable, observable, and, in many cases, predictable. Whether you’re analyzing the volatility of the market through vehicles like the SPDR S&P 500 ETF Trust or underwriting a homeowner’s policy, the same principle applies: risk management drives outcomes both financially and physically.
Market Volatility and Mental Health: The Silent Correlation
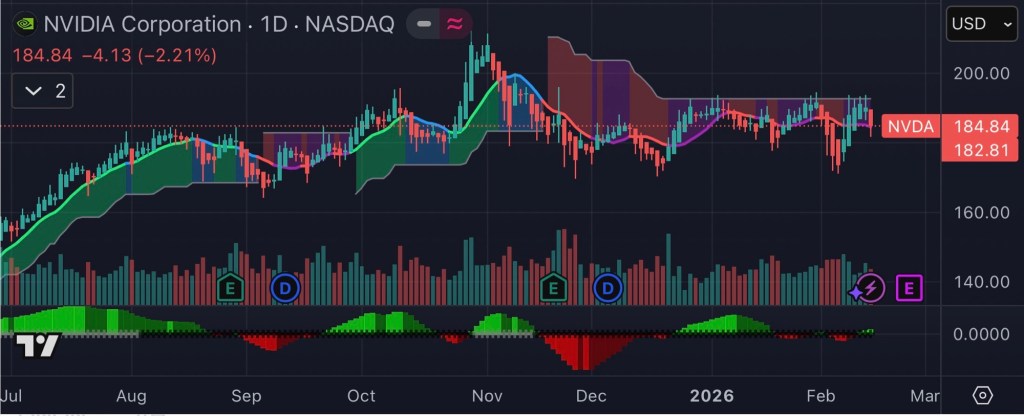
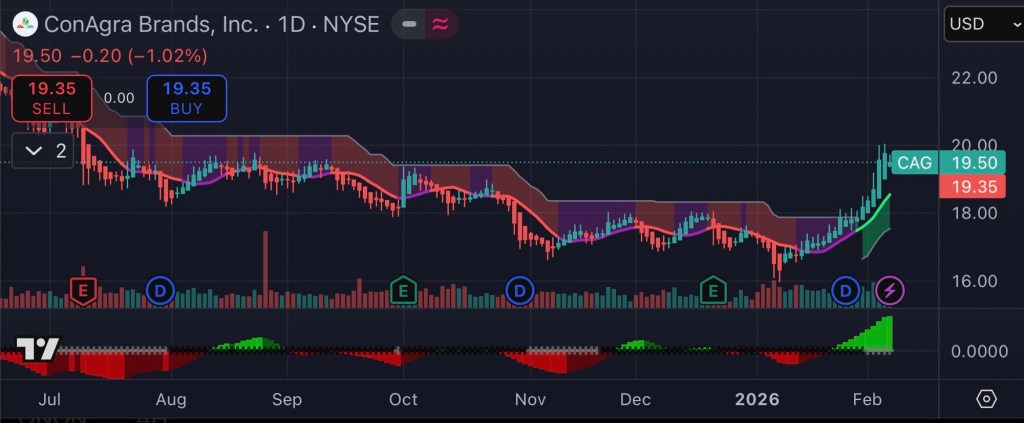
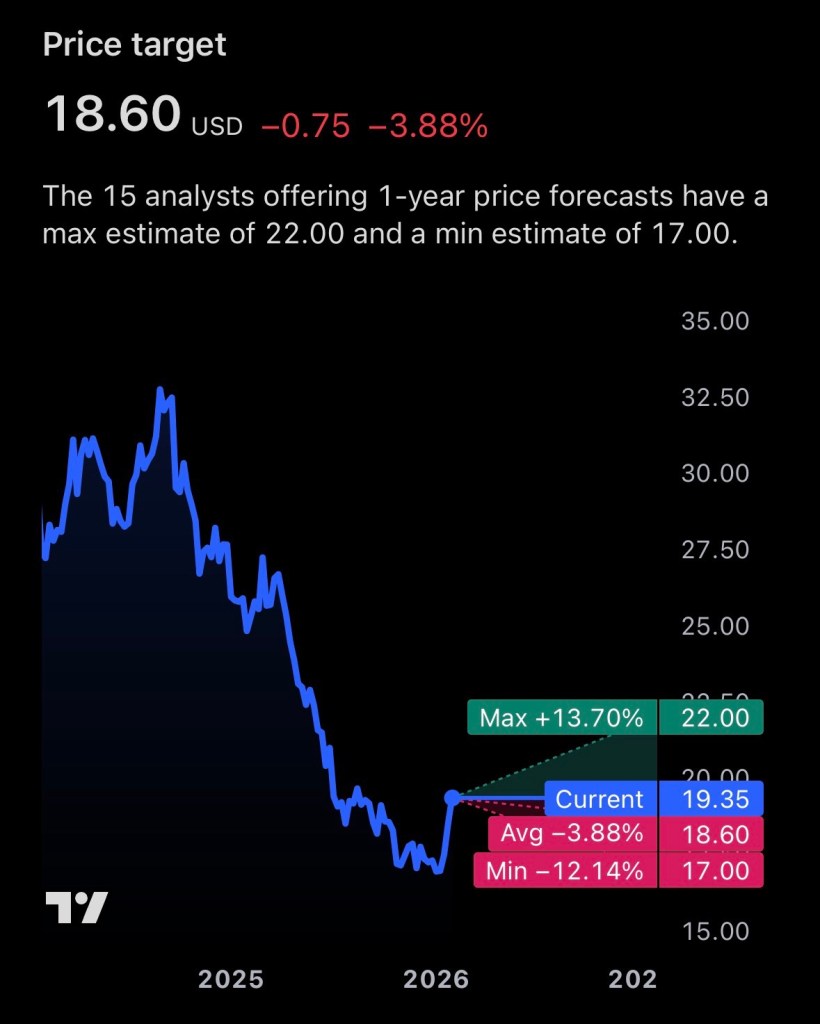
As illustrated in the market activity above, even broad-based investments can experience short-term declines. While seasoned investors understand this as normal market behavior, the psychological response is often anything but rational.
Periods of drawdown like recent fluctuations in the S&P 500 can trigger stress responses similar to those seen in high-risk professions. Elevated cortisol levels, poor sleep, and impulsive decision-making (panic selling, overtrading) are common. In financial terms, this is known as behavioral risk and it can erode long-term returns faster than market downturns themselves.
From a health standpoint, chronic stress is linked to:
- Cardiovascular disease
- Weakened immune response
- Reduced cognitive performance
Translation: Poor financial discipline doesn’t just hurt your portfolio it can degrade your physical health.

Insurance: The Health Buffer You Don’t Think About
In the insurance industry, we view risk through a different but parallel lens. Policies aren’t just financial tools; they are health preservation mechanisms.
Consider this:
- A homeowner without proper coverage facing a catastrophic loss (fire, hurricane, liability claim) doesn’t just experience financial strain it often leads to anxiety, depression, and long-term instability.
- Conversely, a properly insured individual has risk transferred, which significantly reduces stress exposure.
This is especially relevant in markets like Florida, where environmental risk is high. Strategic coverage wind mitigation credits, flood insurance, liability umbrellas does more than protect assets. It protects peace of mind, which is directly tied to long-term health outcomes.
Wealth Building as a Health Strategy
There’s a growing body of thought especially among financial planners and risk professionals that wealth is a form of preventative medicine.
Here’s how:
- Liquidity Reduces Stress
Emergency funds and accessible capital eliminate the “fight-or-flight” response during crises. - Diversification Mirrors Healthy Living
Just as a balanced diet prevents overexposure to one risk factor, diversified portfolios reduce systemic financial risk. - Long-Term Planning Promotes Stability
Retirement accounts, life insurance, and asset protection strategies create predictability one of the most powerful contributors to mental well-being.
The Discipline Overlap: Investors vs. Insureds
The most successful individuals in both investing and insurance share identical behavioral traits:
- Consistency over intensity (dollar-cost averaging vs. regular policy reviews)
- Risk awareness without fear-based decisions
- Long-term thinking over short-term reactions
This overlap is not coincidental it’s structural. Both disciplines reward those who understand that risk isn’t something to avoid it’s something to manage intelligently.

Final Analysis: Health and Wealth Are Not Separate Systems
The traditional view separates financial planning and personal health into different domains. That view is outdated.
- Poor financial decisions → Increased stress → Negative health outcomes
- Lack of protection (insurance gaps) → Catastrophic loss → Long-term instability
- Disciplined investing + proper coverage → Reduced stress → Improved overall well-being
Bottom line:
The same habits that build wealth discipline, planning, risk management are the exact habits that sustain long-term health.
Closing Thought
Whether you’re reviewing your investment portfolio or evaluating your insurance coverage, you’re not just making financial decisions you’re making lifestyle decisions that will compound over time.
Because in the end, the real ROI isn’t just measured in dollars… it’s measured in how well and how peacefully you live.
About the Author:
David Dandaneau is a client relations analyst that covers the insurance and financial services industry. He is known for his insightful analysis and comprehensive coverage of market trends and regulatory developments.