Understanding MINA: Risks and Rewards in the Crypto Market

Mina Protocol markets itself as the “lightest blockchain” — a layer-1 that stays tiny by using recursive zero-knowledge proofs (zk-SNARKs) so the entire chain remains a succinct ~22KB snapshot instead of a growing ledger. That design promises a blockchain any device can verify, lowering node requirements and enabling on-device privacy-aware dApps (zkApps). Those technical foundations are Mina’s headline differentiator and the core reason some investors treat MINA as a long-term hold. (Mina Protocol+1)

Where MINA stands right now

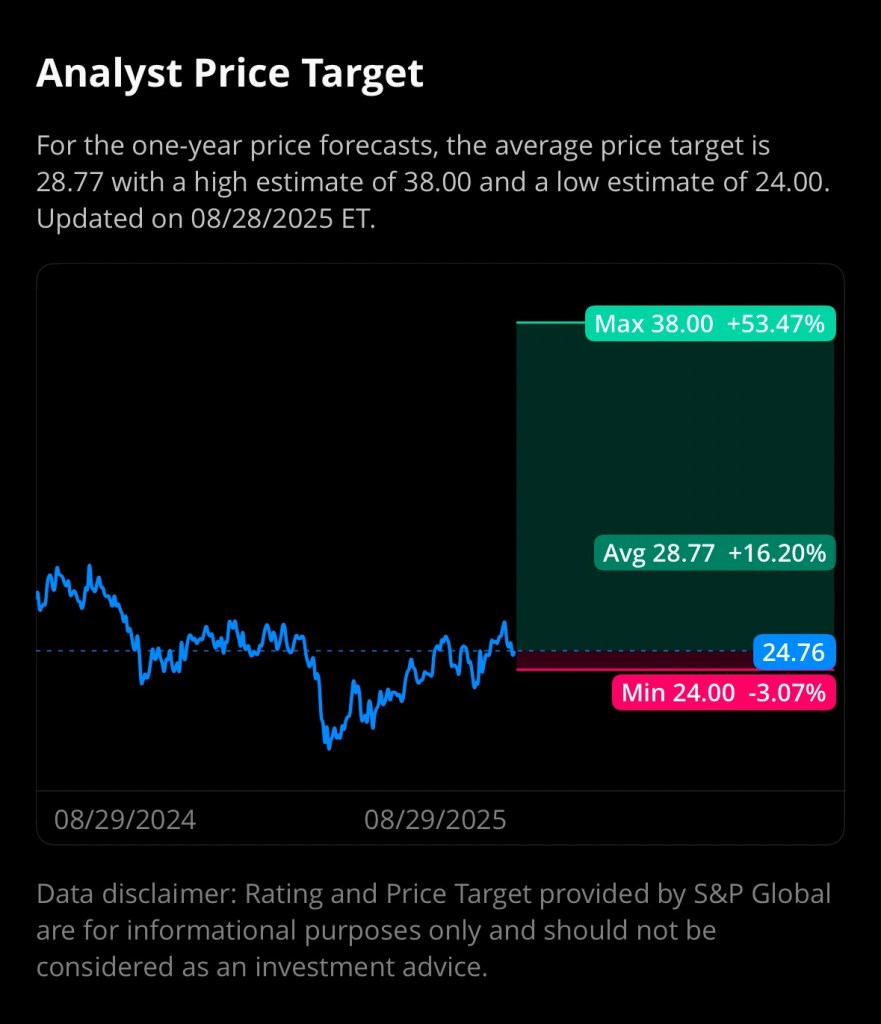
As of early November 2025, MINA trades in the low-to-mid $0.17–$0.19 range with a market cap in the low hundreds of millions of dollars and roughly 1.26 billion MINA circulating. Price and ranking vary by source and exchange, but major market trackers show MINA as a mid-to-low market-cap altcoin. (CoinMarketCap+1)

Why investors like MINA — the bullish case

  1. Truly lightweight chain: Mina’s constant-sized blockchain (~22KB) lowers the hardware and bandwidth needed to run a full node, which could help decentralize participation and boost mobile/edge use cases. This is fundamental to Mina’s pitch as a “blockchain for everyone.” (Nansen Research+1)
  2. Zero-knowledge programmability (zkApps): Mina’s zkApp framework enables privacy-preserving smart contracts and verifiable off-chain computation. If ZK tech becomes central to mainstream Web3 privacy and scaling, Mina could capture unique developer interest. (Mina Protocol)
  3. Staking yields / network rewards: MINA supports staking and many exchanges and platforms offer competitive staking APRs (examples reporting 6–12% or higher on various platforms), which attracts yield-seeking holders who prefer passive income while they wait for price appreciation. (Kraken+1)
  4. Active roadmap and ecosystem work: Core development groups and community initiatives continue evolving Mina (roadmaps and upgrades in 2024–25 aim at tooling, zk developer onboarding, and greater interoperability). Continued protocol development can improve utility and adoption. (Mina Protocol+1)
  5. Relatively small market cap = upside if narrative wins: Compared with top L1s, Mina’s market cap is modest, so positive adoption or a crypto risk-on rotation could produce outsized percentage gains (classic “small-cap upside” dynamic).

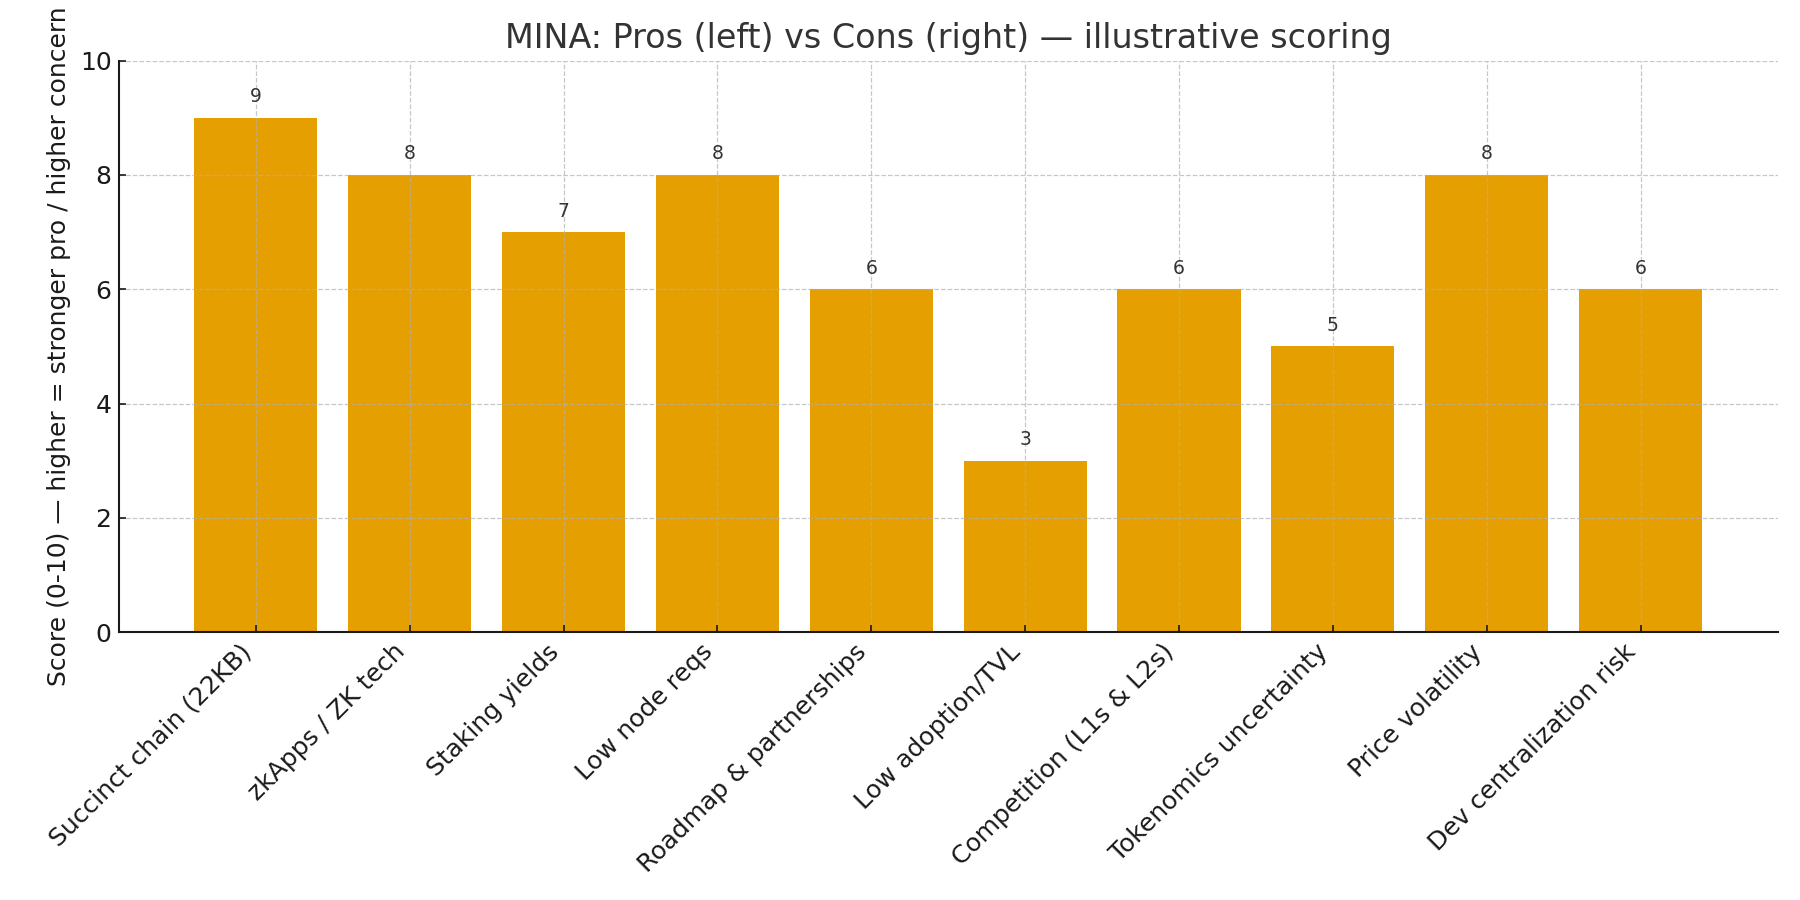
Risks and why caution is warranted

  1. Adoption & TVL remain low vs major L1s: For MINA to move materially higher, it needs more apps, users, and locked value. Today it’s still a niche stack versus giants like Ethereum, Solana, or new ZK-focused rivals. Low TVL limits organic utility demand for the token. (CoinGecko+1)
  2. Strong competition: Other projects are pursuing ZK tech, rollups, and lightweight verification. If larger ecosystems integrate similar ZK capabilities (or if Ethereum rollups dominate the ZK narrative), Mina’s unique edge could shrink. (o1Labs)
  3. Tokenomics & supply dynamics: A large circulating supply (~1.26B MINA) and ongoing issuance/staking rewards can dilute price upside unless demand grows to absorb supply. Coin trackers list circulating supply but no fixed “max” supply, so inflation mechanics matter to holders. (CoinMarketCap)
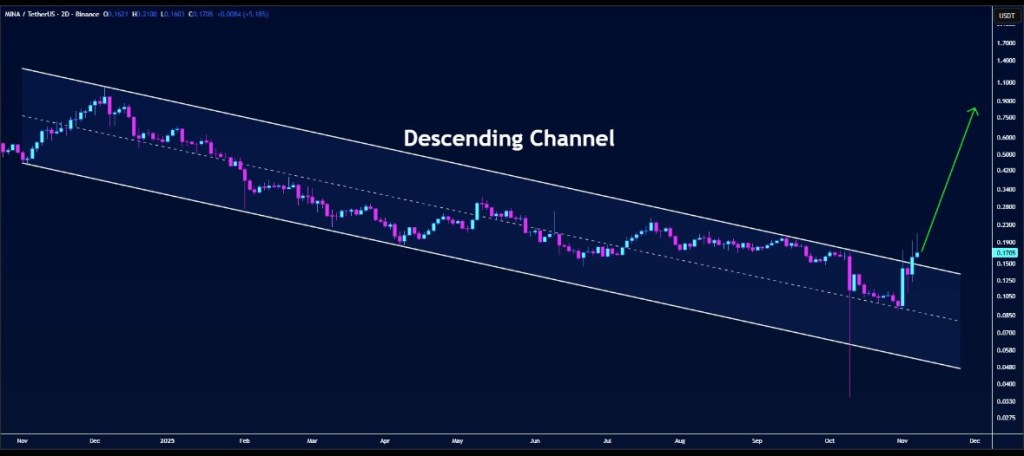
  4. Price volatility & market risk: As a mid/low-cap crypto, MINA is susceptible to broad market moves, liquidity shocks, and volatility — factors that can erase gains quickly. Historical price charts show sharp swings that should caution risk-sensitive investors. (Yahoo Finance)
  5. Technology / centralization risk: While Mina’s research teams (o1 Labs, Mina Foundation, community contributors) are active, concentrated development or coordination risks exist — and any delays or setbacks to roadmap items could temper market enthusiasm. (o1Labs)

Potential upside in an “altcoin season”

Altcoin seasons reward narratives — smaller caps with clear, differentiated value propositions often run hardest. Mina’s narrative (real ZK programmability + tiny chain size) fits a neat theme: privacy, edge verification, and on-device dApps. If the ZK narrative accelerates — through developer tool improvements, interoperability wins (projects like Aligned working on ZK verification integrations), or a wave of zkApps adoption — MINA could outpace larger, less nimble chains. Several mid-2024–25 developments and roadmap items indicate the team remains focused on ZK tooling and ecosystem funding, which would be the necessary fuel for such a move. (o1Labs+1)

How an investor might position (not financial advice)

  • Long-term speculative hold: If you believe ZK tech and ultra-light clients matter, a small allocation to MINA (size depending on risk tolerance) could be reasonable — especially if you stake to capture yield while waiting for adoption. (Kraken)
  • Event-driven trade: Watch roadmap milestones, zkApp launches, partnerships (e.g., Aligned/Ecosystem announcements), and listings/staking product rollouts. Positive, repeated dev activity and growing on-chain usage are bullish triggers. (Mina Protocol+1)
  • Risk management: Given volatility and competition, position sizing, stop levels, and a clear thesis (what adoption metric would make you add more vs cut losses) are essential.

End Result

Mina’s technology is interesting and differentiated: a truly succinct chain with ZK programmability that theoretically lowers barriers to running full nodes and enables privacy-preserving dApps. That technical moat gives MINA a plausible role in a future Web3 where ZK proofs are central. However, adoption, TVL, competition, tokenomics, and market volatility remain the main hurdles. For investors, MINA looks like a classic higher-risk, higher-optional-upside altcoin: attractive to those who believe in ZK-native dApps and willing to stomach swings; less attractive to conservative crypto investors who prefer larger, more established L1 ecosystems. (Mina Protocol+2CoinMarketCap+2)

Disclaimer

I currently hold a position in MINA. The views and opinions expressed in this article are my own and are provided for informational purposes only. This content should not be construed as financial, investment, or trading advice. Always conduct your own research or consult with a licensed financial advisor before making investment decisions.

References

CoinMarketCap. (2025, November 8). Mina (MINA) price, charts, and market cap. Retrieved from https://coinmarketcap.com/currencies/mina-protocol/

Mina Foundation. (2025). Mina Protocol documentation and roadmap. Retrieved from https://docs.minaprotocol.com/

o(1) Labs. (2024). Mina Protocol: The world’s lightest blockchain powered by zero knowledge. Retrieved from https://o1labs.org/

Messari. (2024, December). Mina Protocol research profile. Retrieved from https://messari.io/asset/mina

CoinGecko. (2025, November 8). Mina (MINA) price and market data. Retrieved from https://www.coingecko.com/en/coins/mina-protocol

Binance Research. (2024). Understanding Mina Protocol: Lightweight blockchain and zkApps. Retrieved from https://research.binance.com/en/projects/mina

Aligned Layer. (2025). Mina zkApp integrations and ecosystem collaborations. Retrieved from https://www.alignedlayer.com/blog/mina-zkapps-integration

Decrypt. (2024, July 14). What is Mina Protocol and how does it use zero-knowledge proofs? Retrieved from https://decrypt.co/resources/what-is-mina-protocol

Staking Rewards. (2025). Mina staking overview and yields. Retrieved from https://stakingrewards.com/crypto-assets/mina/

Opendoor Technologies: Rising Star or Risky Bet?

Opendoor Technologies (NASDAQ: $OPEN), the best-known public “iBuyer” that buys, renovates and resells homes, has gone from near-obscurity to the center of a retail-investor frenzy — and to a renewed debate among analysts about whether the company is finally turning a corner or simply a high-risk turnaround story.

Over the last few months OpenDoor’s shares have swung dramatically: the stock traded around $7.70–$8.00 at the end of October 2025 and the company’s market capitalization sits in the $5–6 billion range, after a year of volatile trading that included a multi-hundred-percent YTD gain. (Yahoo Finance+1)

What changed recently

Several headline events have driven sentiment:

  • Leadership and board moves: Opendoor brought in Kaz Nejatian (former Shopify COO) as CEO and welcomed co-founders (including Keith Rabois) back into senior board roles; those governance shifts have been cheered by retail investors and credited with a share-price pop. (Barron’s)
  • Institutional attention and retail momentum: a disclosed stake by trading firm Jane Street and visible retail groups (“Open Army”) helped amplify demand and liquidity in the stock, intensifying swings. (Investopedia+1)
  • Changing operating results: Opendoor reported stronger operating metrics in 2025 quarters, including a notable adjusted-EBITDA improvement (the company posted roughly $23M adjusted EBITDA in Q2 2025), and guidance that signaled more predictable contribution profit heading into Q3 — although management warned of macro and inventory risks. (investor.opendoor.com+1)

Those items explain the run-up in price and the renewed investor conversation — but they do not answer whether the stock is a good investment for a given investor. Below we lay out the primary reasons for and against considering Opendoor as a buy, and then present a compact comparison table against a few direct/adjacent competitors.


Investment case — the arguments for buying

  1. Path to a more capital-light business mix. Management has publicly emphasized diversifying away from pure house flipping and toward capital-light revenue (listings, agent referrals and platform services). If executed, that could reduce inventory/interest-rate exposure and lift margins. (Nasdaq)
  2. Operational improvement indicators. Opendoor reported improved contribution margins/adjusted EBITDA in 2025 quarters, indicating they can be profitable on a run-rate basis under current housing conditions when volumes and pricing cooperate. That shows the business has levers to control costs and marketing spend. (investor.opendoor.com+1)
  3. Retail + selective institutional support can sustain valuation re-rating. The combination of vocal retail investors and large trading desks taking stakes can produce favorable secondary-market momentum and liquidity — often important for smaller, restructuring names. Recent stake disclosures and active retail communities materially contributed to price appreciation. (Investopedia+1)

Investment case — the arguments against buying

  1. Still fundamentally exposed to housing and rates. iBuying profitability depends on narrow purchase/resale spreads. High mortgage rates, slower transaction volumes and inventory carrying costs can quickly turn contribution profit negative; management itself has warned of those macro risks. (AInvest)
  2. Historical unprofitability and scale risk. Despite pockets of positive adjusted EBITDA, Opendoor remains a company that has reported large GAAP losses in recent years and must prove sustained, repeatable profitability at scale. Analysts and some sell-side desks still view the firm skeptically. (Investopedia+1)
  3. Valuation and momentum risk (meme-stock dynamics). Part of the recent price action appears driven by retail fervor and narrative (founder/board changes, social campaigns). If sentiment cools or short interest/unfavorable headlines resume, the stock can be highly volatile. Institutional disclosures (e.g., Jane Street) can be neutral in economic intent — they don’t guarantee long-term fundamental support. (Investopedia+1)

Quick facts & signals investors should check before deciding

  • Recent price / market cap: ~$7.7–$7.8 per share, market cap roughly $5–6B (end of October 2025). (Yahoo Finance+1)
  • Recent operating cue: Q2 2025 reported ~$1.6B revenue and $23M adjusted EBITDA (management said this was their first quarter of positive adjusted EBITDA in the recent cycle). Management gave guidance for Q3 2025 but flagged inventory & macro risks. (investor.opendoor.com+1)
  • Sentiment shocks: Return of co-founders/board changes + Jane Street stake disclosure drove major intraday moves and an extended retail buying wave in mid-to-late 2025. (Barron’s+1)

Comparison table — Opendoor vs. selected competitors (price & recent fluctuations)

Table shows representative market snapshots and price-movement indicators as reported publicly in late Oct 2025. Percent figures are illustrative based on publicly reported YTD or 1-year performance where available; use the cited links to verify live numbers before trading.

Company (ticker)Business focusRepresentative price (late Oct 2025)Market cap (approx.)Notable recent move / comment
Opendoor (OPEN)iBuyer / online home marketplace~$7.7 (Oct 31, 2025). 52-wk range: $0.51–$10.87.$5–6B.Big YTD rally driven by board changes, CEO hire & retail interest; Q2’25 adjusted EBITDA improvement. (Yahoo Finance+2StockAnalysis+2)
Zillow Group (ZG)Online listings, marketplace, mortgages (adjacent)~$71 (Oct 2025)~$17B.Larger, diversified play in online real estate and mortgage; more mature revenue streams. (StockAnalysis+1)
Offerpad (OPAD)iBuyer / home transaction services~$2.3 (Oct 31, 2025); 52-wk range: 0.91–6.35~$80–100M market cap (small-cap)Smaller competitor in same model; more levered to local execution and operational differences; higher volatility. (StockAnalysis+1)
Redfin (RDFN)Brokerage + tech (acquisition announced)Acquisition / deal value $12.50-per-share by Rocket (2025)Deal value ≈ $1.75B (acq. by Rocket Cos.)Redfin was being acquired by Rocket Companies in 2025 — that transaction changes the public-peer landscape. (AP News+1)

Sources: company investor pages, mainstream financial sites and news coverage (see citations). (AP News+4investor.opendoor.com+4Yahoo Finance+4)


How a pragmatic investor might think about sizing a position

  • Risk-aware, small allocation: If you believe management can execute and you want exposure to an asymmetric upside (turnaround + retail momentum), consider a modest, portfolio-hedged allocation (small percent of liquid equities), with strict stop or re-evaluation triggers tied to subsequent earnings and inventory metrics.
  • Event-driven play: Some traders view Opendoor as an event trade (earnings, board/management updates). That strategy requires active monitoring and is not suitable for buy-and-hold retirement capital.
  • Avoid if you need steady income/low volatility: Opendoor is not a conservative equity — it’s a high-volatility name with housing and interest-rate sensitivity.

What to watch next (near-term catalysts)

  1. Q3 2025 earnings / management commentary (Nov 6, 2025): updated revenue, contribution profit, inventory levels and margin guidance will matter. Opendoor plans a novel “Financial Open House” investor presentation that could influence retail interest. (investor.opendoor.com+1)
  2. Inventory and financing costs: how much inventory they hold and the cost to finance that inventory as mortgage rates move. (AInvest)
  3. Any further institutional filings: large 13F/13D/13G filings or insider transactions (adding/removing high-profile board members) can swing sentiment quickly. (Investopedia+1)

Long and Short

Opendoor sits at the intersection of a real operational story (improving contribution metrics, attempts to move into capital-light revenue) and a high-sensation market story (retail fervor, activist board moves, and short-squeeze/meme dynamics). That combination creates both upside and downside:

  • If you believe management can repeat profitable quarters, diversify revenue and steadily shrink inventory risk, Opendoor could be a high-reward turnaround play.
  • If you believe that housing-cycle risk, rate sensitivity, and structurally low flipping spreads will persist, then the stock remains a speculative, momentum-driven bet that could reverse sharply.

Before making any trade, check the latest quarter results, read management’s Q&A from the upcoming November presentation, and confirm up-to-the-minute prices/position filings — the environment around Opendoor is unusually fast-moving and sentiment-sensitive. (investor.opendoor.com+2Quiver Quantitative+2)

Disclaimer

I currently hold a personal position in Opendoor Technologies Inc. (NASDAQ: OPEN).
This article is provided for informational and educational purposes only and does not constitute financial advice or a recommendation to buy, sell, or hold any securities.
Investors should conduct their own research or consult a licensed financial advisor before making investment decisions.

References

Barron’s. (2025, October 31). Opendoor Technologies Inc. (OPEN) stock price, quote, and news. Retrieved from https://www.barrons.com

Business Insider. (2025, October 31). Opendoor Technologies Inc. (OPEN) stock performance and financial data. Retrieved from https://markets.businessinsider.com

CNBC. (2025, October 25). Opendoor shares surge after leadership shake-up and board changes. Retrieved from https://www.cnbc.com

MarketWatch. (2025, October 31). Opendoor Technologies Inc. stock overview and financial results. Retrieved from https://www.marketwatch.com

Nasdaq. (2025, October 30). Opendoor Technologies Inc. (OPEN) company profile and financials. Retrieved from https://www.nasdaq.com

Opendoor Technologies Inc. (2025). Q2 2025 shareholder letter and financial results. Retrieved from https://investor.opendoor.com

Reuters. (2025, October 27). Opendoor Technologies sees EBITDA improvement, guidance for Q3 2025. Retrieved from https://www.reuters.com

Seeking Alpha. (2025, October 28). Opendoor Technologies Q2 earnings report analysis. Retrieved from https://seekingalpha.com

Yahoo Finance. (2025, October 31). Opendoor Technologies Inc. (OPEN) stock price, history, and market cap. Retrieved from https://finance.yahoo.com

Zillow Group Inc. (2025, October 30). Company financials and stock price. Retrieved from https://www.zillowgroup.com

Offerpad Solutions Inc. (2025, October 30). Company profile and stock chart. Retrieved from https://www.offerpad.com

Redfin Corporation. (2025, October 29). Rocket Companies announces acquisition of Redfin at $12.50 per share. Retrieved from https://www.redfin.com/news

📊 Top Technical Indicators Every Trader Should Know

When it comes to trading stocks, investors often fall into two camps — those who focus on company fundamentals and those who rely on technical analysis. While fundamental analysis looks at balance sheets, earnings, and valuations, technical analysis dives into price action, chart patterns, and indicators to forecast future moves.

For traders aiming to make timely buy or sell decisions, technical analysis offers a crucial advantage — helping identify trends, reversals, and potential entry and exit points.

Below are some of the most widely used technical indicators, their purposes, and why they matter in today’s volatile market.


🔍 The Most Common Technical Indicators

IndicatorWhat It MeasuresWhy Traders Use ItBest For
Moving Average (MA)Smooths out price data to identify trend direction over time.Helps confirm whether a stock is in an uptrend or downtrend; filters out noise.Trend-following and long-term investing.
Relative Strength Index (RSI)Measures the magnitude of recent price changes to identify overbought or oversold conditions.Warns when a stock may be overextended and due for a pullback or reversal.Spotting reversals and short-term corrections.
Moving Average Convergence Divergence (MACD)Compares two moving averages to identify changes in momentum.Signals potential buy or sell opportunities when lines cross.Momentum trading and confirming trend shifts.
Bollinger BandsUses standard deviation to define price volatility around a moving average.Shows when prices may be too high or too low relative to recent movements.Volatility trading and breakout detection.
Fibonacci Retracement LevelsHighlights potential reversal zones based on key percentage levels (23.6%, 38.2%, 61.8%).Used to predict potential support or resistance levels.Swing trading and pullback analysis.
VolumeTracks the number of shares traded during a period.Confirms the strength of price movements; rising volume supports the trend.All trading styles.
Stochastic OscillatorCompares a stock’s closing price to its price range over a period.Helps pinpoint overbought and oversold conditions similar to RSI but more sensitive.Short-term timing of trades.
Average True Range (ATR)Measures market volatility by analyzing the range of recent price movements.Helps set realistic stop-loss levels and position sizing.Risk management and volatility assessment.

💡 Why Technical Tools Matter

  1. Better Timing:
    Technical indicators help traders time their entries and exits more effectively — a critical edge in short-term trading.
  2. Objective Decision-Making:
    Instead of relying on emotions or market rumors, indicators provide quantifiable signals based on data.
  3. Risk Management:
    Tools like ATR and volume analysis help traders control risk exposure and avoid chasing unstable moves.
  4. Market Confirmation:
    When multiple indicators align — such as RSI showing strength and MACD confirming a bullish crossover — confidence in a trade setup grows significantly.

⚠️ A Word of Caution

No single indicator guarantees success. In fact, overloading your chart with too many signals can cause “analysis paralysis.” The key is to combine two or three complementary indicators that confirm one another — such as using a moving average for trend, RSI for momentum, and volume for confirmation.


✅ The Takeaway

Technical analysis isn’t about predicting the future — it’s about improving probabilities. When used correctly, these tools help traders manage risk, find higher-probability trades, and stay disciplined through market noise.

Whether you’re day trading or swing trading, understanding the language of charts and indicators can help you make smarter, more confident investing decisions.

“At the Trough” — Why Webull Corporation (NASDAQ: BULL) Might Be Worth a Fresh Look

TAMPA – October 21, 2025 — The brokerage and trading-platform firm Webull Corporation (ticker BULL) finds itself trading near multi-year lows. For value-oriented investors, that raises a classic question: Is this a moment of opportunity, or a warning that things are worse than they appear?

Here’s what investors need to know:


1. The Case For: Potential Upside From a Low Base

  • Webull reported strong top-line growth in recent quarters. In Q1 2025, revenues rose by 32 % year-over-year to about US$117 million, and the company swung from a loss to a net income of around US$12.9 million. (PR Newswire+2StockAnalysis+2)
  • In Q2 2025, revenue came in at roughly US$131.5 million, up ~46 % vs Q2 2024 (~US$90.1 million) — showing accelerating growth in that period. (Investing.com+2WallStreetZen+2)
  • The stock has already fallen steeply from its earlier highs. Some market commentary suggests that when a stock has dropped hard, it might set up for a rebound if fundamentals improve. (Value The Markets+1)
  • Webull’s business model—zero-commission trading, fractional shares, global expansion—remains relevant in the growing world of retail finance and digital investing. Supportive structural tailwinds could help long-term. For example, the company claims global reach and a broad user base. (AInvest+1)

2. The Case Against: Key Risks That Still Loom

  • While revenue is growing, the annual full-year revenue for 2024 was essentially flat compared to 2023 (~US$390.2 million in both years) — indicating growth isn’t guaranteed or smooth. (WallStreetZen+1)
  • Profitability remains a concern: Return on equity and profit margins are weak or negative in many recent periods. (Simply Wall St+1)
  • The company competes in a crowded sector (digital brokerages, fintech platforms) with strong incumbents like Robinhood Markets. Analysts have flagged slower growth vs bigger rivals. (Webull+1)
  • There are corporate-structure complexities and lock-up/share dilution risks. A financial-news piece noted that if the stock trades above US$12 for 20 days, up to 25 % of locked shares might be released, potentially expanding supply. (Money Morning)

3. Why “At All-Time Lows” Could Be a Turning Point

Many stocks trade at depressed levels because the market has lost confidence. That creates a scenario where:

  • The “bad news” may be largely baked into the price, so incremental positive surprises can have outsized impact.
  • A low base offers more upside potential if things go well (i.e., less downside cushion).
    For Webull, if growth continues and profitability improves, the market could reward the turnaround possibility. On the flip side, if risks intensify, the low price could still go lower.

4. What to Monitor Going Forward

Investors considering Webull should keep a close eye on:

  • Upcoming quarterly results: Are revenues continuing to grow at high rates? Are expenses under control?
  • Account growth and trading volume: How many active/funded accounts? What is customer asset growth?
  • Profit margins and net income: Are they trending toward consistent profitability?
  • Share-count / dilution risk: Are there significant new shares coming? Are previously locked shares being released?
  • Competitive dynamics and regulatory risks: Any new regulatory headwinds? How is Webull distinguishing itself vs other brokers?

5. Summary: A High-Risk, High-Potential Setup

In short: Webull is not a safe, boring investment. It carries meaningful operational and structural risk. But the combination of decent recent growth, a depressed share price, and a business model aligned with retail investing trends makes it plausible that at these levels, the upside could be interesting if things go right.

For investors comfortable with risk and looking for speculative exposure in the fintech/brokerage space, BULL might offer a worthwhile “bet.” For more conservative investors, the uncertainty may be too large.

Before investing, one should do their own due diligence, weigh risk vs reward carefully, and consider how this fits into an overall portfolio.


https://content.stockstotrade.com/wp-content/uploads/2025/10/watermarked_BULL_2025-10-10T14-05-scaled.png
https://csv-storage.forexpros.com/slides/ddc6db61fc7fc26d73488dab0804c906c7608c6f44146b9c7b259e50f98c47a1.png
https://csv-storage.forexpros.com/slides/dd5e6af6d041cd8914e7ac5f888864b9d9ff042c7f3bad9d0e458507b3c5eab2.png

Above: Representative charts showing (1) share-price path of Webull (BULL), (2) recent revenue growth, (3) user growth/expansion metrics.


Disclaimer

This is not financial advice. The information above is for educational and informational purposes only. Investing involves risks, including loss of principal. Always consult a qualified financial advisor regarding your specific situation.

References

AINVEST. (2025, April 20). Webull stock: 2 reasons to buy, 4 reasons to sell. AINVEST.com. https://www.ainvest.com/news/webull-stock-2-reasons-buy-4-reasons-sell-2504-63/

Investing.com. (2025, August 8). Webull Q2 2025 slides: Revenue jumps 46%, achieves third profitable quarter. Investing.com. https://www.investing.com/news/company-news/webull-q2-2025-slides-revenue-jumps-46-achieves-third-profitable-quarter-93CH-4215463

Money Morning. (2025, April 14). Warning: Read this before you buy Webull (BULL) stock. MoneyMorning.com. https://moneymorning.com/2025/04/14/warning-read-this-before-you-buy-webull-bull-stock/

PR Newswire. (2025, May 13). Webull reports first quarter 2025 financial results. PR Newswire. https://www.prnewswire.com/news-releases/webull-reports-first-quarter-2025-financial-results-302463555.html

Simply Wall St. (2025). Webull Corporation (NASDAQ: BULL) past performance and analysis. SimplyWall.st. https://simplywall.st/stocks/us/diversified-financials/nasdaq-bull/webull/past

Value The Markets. (2025, June 30). Webull Corporation stock (BULL): Is it a buy at these levels? ValueTheMarkets.com. https://www.valuethemarkets.com/analysis/webull-corporation-stock-bull

WallStreetZen. (2025). Webull (BULL) revenue 2023–2025. WallStreetZen.com. https://www.wallstreetzen.com/stocks/us/nasdaq/bull/revenue

Webull. (2025, July 22). Webull news update: Market and company overview. Webull.com. https://www.webull.com/news/12711197501137920

Zeta Global: A High-Growth Martech Investment Opportunity

Quick take: Zeta Global, the AI-driven marketing cloud, has delivered a string of better-than-expected quarters, is guiding to another year of strong revenue growth, and just made a big acquisition to expand its loyalty and enterprise footprint. That combination — accelerating revenue, improving profitability guidance, and strategic M&A — is why some investors are re-rating the stock. Below: the facts, the catalyst, a compact risk view, and a chart/table that show the growth story.


Headlines and the data points you need

  • Zeta reported Q2 2025 revenue of $308.4 million, a ~35% year-over-year increase vs. the prior year quarter. (Nasdaq)
  • For full-year 2024 Zeta generated about $1.01 billion in revenue. (Zeta Global)
  • Management has repeatedly “beat and raise” — most recently increasing full-year 2025 revenue guidance to $1,258–$1,268 million (midpoint ~$1.263B) and raising Adjusted-EBITDA and free-cash-flow ranges as well. Those revisions reflect faster growth and improving margins. (Zeta Global+1)
  • Zeta announced a large acquisition (Marigold’s enterprise business — including Cheetah Digital, Selligent, Sailthru and other assets) to strengthen loyalty and enterprise offerings, a move management says accelerates international reach and cross-sell opportunities. (Zeta Global+1)
  • Market snapshot (at time of writing): share price ≈ $20.37 and market cap in the mid-$4 billion range — investors are paying for fast growth but also a path to profitability. (Yahoo Finance)

Why this could be an attractive investment (the bull case)

  1. High single- to double-digit top-line growth that’s accelerating. Zeta’s recent quarters show consistent revenue acceleration (Q2 ’25 +35% YoY), a key signal for growth investors in the martech/adtech space. Management’s upward guidance for FY-2025 reinforces that it’s not just one quarter of outperformance. (Nasdaq+1)
  2. Improving operating leverage and cash generation. The company has raised Adjusted-EBITDA and free-cash-flow guidance, pointing to margin expansion. That’s important: investors reward companies that can turn revenue growth into sustainable profits and cash. (Zeta Global)
  3. Strategic M&A that fills capability gaps and expands addressable market. The Marigold enterprise business deal adds loyalty platforms and prominent enterprise customers (and EMEA coverage), enabling more cross-sell inside an existing customer base and a larger recurring revenue pool. If integration goes smoothly, this can boost both revenue and churn resilience. (Zeta Global+1)
  4. Compelling unit economics at scale. Zeta reports improving ARPU (average revenue per scaled customer) and strong net revenue retention metrics, which suggest existing customers are spending more — a powerful multiplier for SaaS-like businesses. (Company disclosures highlight rising Scaled and Super-Scaled customer ARPU.) (Zeta Global+1)
  5. Positive technical / market interest. Stock research outlets have recently upgraded technical scores (e.g., IBD RS rating rise), indicating renewed investor interest that can amplify returns if fundamentals keep improving.( Investors.com)

Compact table: key metrics (source notes below)

MetricValue (most recent / guidance)Source
Q2 2025 revenue$308.4M (+35% YoY)Company results / press release. (Nasdaq)
FY 2024 revenue$1,006M (≈$1.01B)FY 2024 report. (Zeta Global)
FY 2025 revenue guidance$1,258–$1,268M (midpoint ≈ $1.263B)Company guidance (beat & raise). (Zeta Global)
Adjusted-EBITDA guidance (FY-25)~$263.6–$265.6MCompany guidance. (Zeta Global)
Share price (snapshot)~$20.37Market quote (timestamped).
Market cap (approx.)Mid ~$4B–$4.8BMarket data providers. (Yahoo Finance+1)

Visual: revenue comparison (Q2 vs prior year, FY 2024 vs FY 2025 guidance)

I created a compact chart and table comparing:

  • Q2 2024 (estimate) vs Q2 2025 actual, and
  • FY 2024 actual vs FY 2025 guidance midpoint.

(Chart and table were prepared from the company reporting and guidance figures cited above).

Sources for the plotted numbers: Q2 2025 revenue and YoY change, FY 2024 totals, and FY 2025 guidance. (Nasdaq+2Zeta Global+2)


Risks — what could go wrong

  • Execution risk on M&A and integration. The Marigold enterprise assets are substantial; integration issues, customer churn, or higher-than-expected costs could blunt the benefits. (Zeta Global)
  • Valuation vs. growth tradeoff. The stock price reflects future growth expectations. If revenue growth slows or margin expansion stalls, multiples can compress quickly. (Yahoo Finance)
  • Adtech / martech competition and cyclicality. The market is competitive (large incumbents and many specialists). Ad/spend cyclicality could affect revenue. Company performance depends on continued client spend and retention. (Zeta Global)
  • Profitability not yet fully GAAP positive. Zeta has narrowed losses but still reports GAAP net losses; investors should watch sustained EBITDA and free-cash-flow conversion. (Zeta Global)

Bottom line (concise)

Zeta Global presents a classic high-growth martech investment case: accelerating revenue, improving profitability guidance, and strategic M&A that extends its product footprint and international reach. That combination can create durable revenue expansion and margin improvement — the ingredients growth investors pay for. But the stock still carries execution and integration risk and depends on preserving high retention and ARPU. If you like fast growth with a clear path to margin expansion and accept the M&A/integration risk, Zeta is a name to research further; if you are risk-averse or need immediate GAAP profitability, it may not fit.

Disclosure:

I do not own any stock or have any financial interest in Zeta Global Holdings (NYSE: $ZETA). This article is for informational purposes only and should not be considered financial or investment advice. Investing in stocks carries risks, and past performance is not indicative of future results. Always conduct your own research and consult with a qualified financial professional before making any investment decisions.

References

Zeta Global Holdings Corp. (2025, August 8). Zeta reports second quarter 2025 financial results; raises full-year 2025 guidance. Zeta Global Investor Relations. Retrieved from https://investors.zetaglobal.com/

Zeta Global Holdings Corp. (2024, February 28). Zeta reports fourth quarter and full-year 2024 results. Zeta Global Investor Relations. Retrieved from https://investors.zetaglobal.com/

Investor’s Business Daily. (2025, September). Zeta Global stock analysis and relative strength update. Investor’s Business Daily. Retrieved from https://www.investors.com/

Reuters. (2025, September). Zeta Global Holdings Corp. company profile and financial summary (ZETA.O). Reuters Markets. Retrieved from https://www.reuters.com/

MarketWatch. (2025, October). Zeta Global Holdings Corp. stock quote & financials (ZETA). MarketWatch. Retrieved from https://www.marketwatch.com/

Business Wire. (2025, July 31). Zeta Global announces acquisition of Marigold’s enterprise business to expand loyalty and EMEA presence. Business Wire. Retrieved from https://www.businesswire.com/

Yahoo Finance. (2025, October 9). Zeta Global Holdings Corp. (ZETA) stock price and market cap data. Yahoo Finance. Retrieved from https://finance.yahoo.com/

Beamr Imaging (BMR): A Speculative Bet with Potential Upside

Herzliya, Israel / U.S. Markets — Beamr Imaging Ltd. (NASDAQ: BMR) is a tiny, high-volatility tech play in the video compression / optimization space. In recent months, it has attracted attention from speculative investors betting on its ability to break into high-growth verticals like autonomous vehicles (AV). Below is a breakdown of its recent developments, risks, and upside potential.


What Does Beamr Do?

Beamr provides software and hardware-accelerated video encoding, transcoding, and optimization solutions. Its product lineup includes:

  • Beamr 4 / 5 (H.264, HEVC) content-adaptive encoders
  • Beamr Cloud (SaaS offering)
  • Beamr IP blocks (for integration into ASICs / GPUs / application processors)
  • JPEGmini photo optimization technology

Its customer base spans streaming platforms, media companies, content distributors, and now increasingly, autonomous vehicle and machine-vision use cases. (Yahoo Finance+2investors.beamr.com+2)

In 2025, the company has doubled down on pushing into the AV market by unveiling a GPU-accelerated video compression solution designed to handle petabyte-scale video data generated by autonomous vehicle fleets. (Investing.com+2Stock Titan+2)

A key value proposition: its compression technology reportedly delivers 20%–50% savings in storage and data transfer costs for customers, without degrading model accuracy in machine vision applications. (Stock Titan+1)


Recent Financials & Metrics

Below is a simplified financial snapshot based on the public disclosures (primarily for 1H 2025). Because Beamr is small and reporting is limited, the data should be taken as directional rather than precise.

Metric1H 2025YoY Change / Notes
Revenue~$1.07 million+7% vs 1H 2024 (Stock Titan+3Investing.com+3Quiver Quantitative+3)
Gross Margin~86%Down from ~91.5% (due to amortization of internal software) (Investing.com+2Quiver Quantitative+2)
R&D Expense~$2.04 million+104% YoY (hiring, subcontractors, cloud costs) (Investing.com+2Quiver Quantitative+2)
Sales & Marketing Expense~$1.06 million+242% YoY (expanding marketing, conferences) (Investing.com+2Stock Titan+2)
Net Loss~$3.18 millionvs $1.96 million loss in 1H 2024 (Investing.com+2Quiver Quantitative+2)
Cash & Equivalents~$13.9 millionRepresents a substantial cushion for a microcap (Investing.com+2Stock Titan+2)

From alternative data sources, Reuters lists Beamr’s total assets at USD 22.095M (latest) and notes negative cash flows from operations, consistent with a growth / development stage firm. (Reuters)

Caveats & caveats:

  • The company is unprofitable and burning cash.
  • Operating expenses are rising aggressively.
  • Revenue scale is still extremely modest.
  • Reporting is limited, making forecasting uncertain.
  • The stock is highly volatile and likely illiquid in many trading periods.

Recent Developments & Catalyst Events

  • AV Market Push: In mid-2025, Beamr formally launched its GPU-accelerated video compression solution for autonomous vehicles, executing multiple proof-of-concept (PoC) deals and aiming to position itself as a bridge between AV fleets (which generate enormous video data) and cost-efficient storage/processing infrastructure. (Yahoo Finance+4Investing.com+4Stock Titan+4)
  • Strong Price Movement on Announcement: When Beamr announced the AV compression launch at the NVIDIA GTC Paris event, the stock spiked ~17% intraday. (RTT News)
  • Oracle Cloud Marketplace Listing & Recognition: Beamr’s product became available in Oracle’s Marketplace (earning “Powered by Oracle Cloud Expertise” status), driving a stock move of ~48% on that news. (The Wall Street Journal)
  • Partnership & Ecosystem Moves: The company joined AWS’s ISV Accelerate program, participated in major industry events (NVIDIA GTC, NAB Show), and secured awards (e.g. NAB Show Product of the Year) for its video technology. (Quiver Quantitative+3Stock Titan+3investors.beamr.com+3)
  • Strong Liquidity Ratio: Reports suggest Beamr had a current ratio (current assets / current liabilities) of ~17.77 in H1 2025, indicating a solid short-term liquidity buffer. (Investing.com)

Why Some Speculators Believe Upside Is Possible

Here’s the bullish thesis (with caveats) for why investors might view Beamr as a high-risk, high-reward play:

  1. Large addressable markets
    • The explosion of video data (streaming, 5G, ML/AI, edge computing) presents tailwinds for efficient compression/optimization.
    • The AV industry is a nascent but rapidly expanding consumer of video/vision data; any solution that materially reduces cost could attract high-value contracts.
  2. Technical differentiation (if proven)
    • If Beamr’s compression can deliver promised 20–50% reductions in storage + network cost without compromising model accuracy or visual quality, that’s a compelling ROI proposition for customers.
    • Their GPU-accelerated and content-adaptive approach may be more scalable and future-forward than legacy compression tools.
  3. Low valuation / optionality
    • As a microcap trading near its cash value, much of the upside is tied to growth and execution (i.e., if they convert PoCs to commercial contracts).
    • If one or two large AV or cloud customers adopt their technology, the “optional upside” is significant.
  4. Momentum & narrative-driven upside
    • In small, speculative tech stocks, favorable press, partnerships, and media hype can drive rapid re-rating.
    • Their association with big names (NVIDIA, AWS, Oracle) lends credibility and can accelerate business traction.
  5. Liquidity cushion
    • Having nearly $14M in cash for a company of this size gives it runway to invest in growth, product development, and marketing (assuming no major execution failure).

Risks That Temper the Speculation

To balance the bullish perspective, here are key risks:

  • Execution risk: Converting PoCs into recurring, large-scale revenue is harder than it looks.
  • Competitive risk: Many large players (cloud providers, codec developers, chipmakers) might replicate or undercut.
  • Burn & dilution risk: Continued losses may force equity raises, which could dilute existing holders.
  • Thin trading / volatility: Stock may swing wildly on news (or lack thereof).
  • Dependence on marquee wins: A few large contracts must validate the model.
  • Technology risk: Compression for human vision is a different problem than “machine vision / AV grade” compression; errors or compromises in accuracy could kill the value proposition.

Outlook & Scenarios

  • Base Case (moderate success): Beamr secures a handful of mid-sized AV or cloud contracts over the next 1–2 years; revenue grows meaningfully, losses narrow, and the stock re-rates modestly (e.g. 2×–3× current valuation).
  • Bull Case (breakthrough): A marquee deal or partnership (e.g. with a top AV OEM or cloud provider) turns into a large recurring revenue stream. The market begins to value Beamr as a strategic infrastructure play, leading to 5×+ upside.
  • Bear Case: Execution falters, PoCs don’t convert, cash burns down, and the company faces liquidity or solvency challenges, dragging the stock back toward cash value (or below).

Disclosure: I currently hold a position in Beamr Imaging Ltd. (NASDAQ: BMR). This article reflects my personal opinions and analysis, and is not intended as financial advice. Please conduct your own research or consult a financial advisor before making any investment decisions.

References

Investing.com. (2025, August 22). Beamr reports 7% revenue growth in first half 2025; launches AV solution. Investing.com. https://www.investing.com/news/company-news/beamr-reports-7-revenue-growth-in-first-half-2025-launches-av-solution-93CH-4187902

Reuters. (2025). Beamr Imaging Ltd (BMR.OQ) company profile & facts. Reuters. https://www.reuters.com/markets/companies/BMR.N/

RTTNews. (2025, March 19). Beamr Imaging stock soars 17% on launch of video compression tech for autonomous vehicles. RTTNews. https://www.rttnews.com/3545934/beamr-imaging-stock-soars-17-on-launch-of-video-compression-tech-for-autonomous-vehicles.aspx

StockTitan. (2025, July 1). Beamr in Q2 2025: Demonstrating the validation of its solution for autonomous vehicles. StockTitan. https://www.stocktitan.net/news/BMR/beamr-in-q2-2025-demonstrating-the-validation-of-its-solution-for-kfcmamrn7nhw.html

The Wall Street Journal. (2025, May 12). Beamr Imaging shares surge 48% on Oracle recognition. The Wall Street Journal. https://www.wsj.com/articles/beamr-imaging-shares-surge-48-on-oracle-recognition-85584b6a

Yahoo Finance. (2025). Beamr Imaging Ltd. (BMR) stock price & news. Yahoo Finance. https://finance.yahoo.com/quote/BMR/

Snowflake (SNOW) Posts Strong Q2, Eyes Deeper AI Integration — Here’s Why It’s Catching Investor Interest

Snowflake Inc. (NYSE: $SNOW) released its second quarter (fiscal 2026) results, reinforcing its role as a data and AI infrastructure play while navigating challenges in profitability and valuation. The reaction in markets suggests that investors are increasingly viewing Snowflake as more than just a cloud data warehousing provider — but as a core enabler of “AI Data Cloud” strategies. Here’s a breakdown of what’s happening, and the bull vs bear cases moving forward.


What the Numbers Say: Q2 & Recent Financials

Revenue, Margins & Growth

  • In Q2 FY2026, Snowflake reported product revenue of $1,090.5 million (i.e. from compute, storage, and data transfer). (Snowflake Investors)
  • The company continues to emphasize net revenue retention, which remains elevated (125%) as of July 31, 2025 — indicating that existing customers are expanding usage. (Snowflake Investors)
  • In its Q4 FY2025 results (ended January 31, 2025), Snowflake posted total revenue of $986.8 million, with product revenue of $943.3 million — up ~28% year-over-year. (Snowflake)
  • The Q4 gross profit margin (GAAP) was ~ 66%, and non-GAAP adjusted gross margin (excluding stock-based comp, amortization, etc.) was ~ 73%. (Snowflake)
  • Snowflake’s Q4 operating loss (GAAP) was about –$386.7 million, but on a non-GAAP basis it posted operating income of $92.8 million (≈ 9% margin). (Snowflake)
  • Its free cash flow in that quarter was ~$415.4 million (≈ 42% of revenue) and adjusted free cash flow ~$423.1 million. (Snowflake)

These numbers show both strength and tension: strong top-line growth and healthy non-GAAP profit conversions, but continued GAAP losses driven by sizable investments, stock compensation, and amortization.

Balance Sheet & Liquidity

  • As of January 31, 2025, Snowflake held ~$2,698.7 million in cash, cash equivalents, and restricted cash. (Snowflake)
  • Total debt (short-term + long-term) is more modest — for example, in recent annual balance sheet summaries, SNOW’s short-term and current portion of long-term debt is listed in the range of ~ $36 million. (The Wall Street Journal)
  • On the assets side, total assets are in the realm of several billions (over $8B to $9B in some reports) with growth trends consistent among public disclosures. (Investing.com+1)
  • The company carries significant liabilities as well (deferred revenue, vendor payables, deferred costs), but its liquidity cushion offers some buffer against short-term shocks. (Investing.com)

Business & Strategic Metrics

  • Snowflake’s remaining performance obligations (RPO) — i.e., contracted but not-yet-recognized revenue — stood at $6.9 billion, growing ~33% year-over-year. (Snowflake)
  • The company serves 580 customers whose trailing 12-month product revenues exceed $1 million, and 745 Forbes Global 2000 customers as of Q4 FY2025. (Snowflake)
  • The 125% dollar-based net revenue retention underlines that Snowflake is often able to upsell or expand within its installed base. (Snowflake Investors)
  • More recently, Snowflake announced its acquisition of Crunchy Data (for ~ $250 million) to integrate Postgres capabilities into its ecosystem, enabling developers to more easily build AI agents and manage data workloads. (The Wall Street Journal+1)
  • The company is also partnering or aligning more closely with AI/LLM providers (e.g., Anthropic), seeking to embed language model capabilities into its platform. (Reuters+2markets.businessinsider.com+2)

What’s Driving the Recent Move & Market Sentiment

In response to its Q4 FY2025 earnings (released earlier in 2025), Snowflake’s stock jumped ~10.9% after hours, as the company beat on earnings (30 cents per share vs ~18 cents expected) and revenue (nearly $987 million vs $957 million consensus). Barron’s It also raised its forecast for product revenue and delivered upbeat guidance for FY2026, projecting ~24% growth to ~$4.28 billion. (MarketWatch+2Barron’s+2)

Investors have taken notice of Snowflake’s push into AI, including more sophisticated integrations with large language models, and its efforts to position itself not just as a data platform but an “AI data cloud” enabler. (markets.businessinsider.com+2Reuters+2)

That said, concerns still linger over valuation multiples (Snowflake trades at high forward multiples), GAAP losses, and macro risk to enterprise IT spending.


Why Some Investors Might Find SNOW Attractive (and Its Risks)

Bull Case

  1. Exposure to Secular Trends in Data + AI
    As enterprises shift toward AI, data modeling, real-time analytics, and agent-based applications, Snowflake sits at a nexus: you need scalable, secure data infrastructure. Its existing customer base, product maturity, and retention metrics lend credibility to that positioning.
  2. Upsell & Expansion Potential
    Snowflake’s high net revenue retention and expanding average spend per customer suggest that a lot of value lies in selling more compute/storage or ancillary AI features to its installed base.
  3. Strategic Acquisitions & Technology Stack Expansion
    The Crunchy Data deal, combined with its AI platform integrations, may help lock in more workloads (especially developer, data app, and AI agent workloads) and reduce friction for adoption.
  4. Cash Generative Capacity (Non-GAAP / FCF)
    Despite GAAP losses, Snowflake has shown strong adjusted free cash flow generation, which gives it flexibility to invest, defend, or expand without complete reliance on external financing.
  5. Backlog / Contracted Revenue Visibility
    The RPO metric provides a view into future revenue, giving some predictability to growth expectations and lessening the reliance purely on new deals.

Risks & Challenges

  • Profitability & Cost Pressure
    Snowflake still runs GAAP losses. Its heavy investment in R&D, sales & marketing, and stock-based compensation make margins sensitive. If growth slows, the pressure on margins will intensify.
  • Valuation Overhang
    At high multiples, the stock’s valuation leaves little room for mistakes. A small slip in guidance or macro softness in enterprise IT spending could cause multiple compression.
  • Competition & Execution Risk
    The competitive landscape is fierce (e.g. Databricks, AWS, Google, Microsoft) and execution (product development, scaling, integrating acquisitions) will matter enormously.
  • Dependence on Cloud Providers
    Snowflake relies on underlying public clouds (AWS, Azure, GCP) for infrastructure. Any changes in pricing, caps, or ecosystem dynamics could affect its cost structure or competitiveness. (Wikipedia+1)
  • Macro / IT Spend Weakness
    In a downturn or with tightening enterprise budgets, large IT and data platform spends may get deferred, impacting growth.
  • Integration and Engineering Complexity
    Adding deeper database, AI, and application layers increases complexity — integrating acquisitions and maintaining stability and performance across features will be demanding.

Outlook & Near-Term Catalysts

  • Snowflake’s guidance for Q1 FY2026 product revenue is in the range $955 million to $960 million. (Snowflake)
  • For full-year FY2026, the company expects ~ 24% product revenue growth to ~$4.28 billion, with non-GAAP product gross margins reaching ~75%. (Snowflake)
  • The success of its Crunchy Data acquisition (Postgres integration), traction of AI integrations (e.g., embedding LLMs for analytics), and customer growth in large enterprises will be closely watched.

If Snowflake can continue delivering above expectations on product revenue, manage its cost base, and ensure that its AI/data additions translate into incremental revenue without diluting execution, it may justify its premium valuation post its recent run.


Verdict & Investor Fit

Snowflake is not a “safe” stock in the sense of predictable earnings or low volatility, but it is a compelling pick for investors with conviction in the data + AI transition and a willingness to ride through lumps. For those looking for asymmetric upside exposure to the AI/data infrastructure stack, SNOW has a profile worth watching — especially if bought during periods of market softness.

Disclosure:

I do not own any stock or have any financial interest in Snowflake Inc. (NYSE: $SNOW). This article is for informational purposes only and should not be considered financial or investment advice. Investing in stocks carries risks, and past performance is not indicative of future results. Always conduct your own research and consult with a qualified financial professional before making any investment decisions.

Barron’s. (2025, August 28). Snowflake stock jumps after earnings beat. Here’s what analysts are saying. Dow Jones & Company. https://www.barrons.com/articles/snowflake-stock-price-earnings-ai-1f2b9a5e

MarketWatch. (2025, August 28). Snowflake’s earnings and revenue beat expectations. Dow Jones & Company. https://www.marketwatch.com/story/snowflakes-earnings-and-revenue-beat-expectations-11695946094

Snowflake Inc. (2025, August 28). Snowflake reports second quarter fiscal 2025 financial results [Press release]. Snowflake Investor Relations. https://investors.snowflake.com/

Yahoo Finance. (2025). Snowflake Inc. (SNOW) financials. Retrieved September 27, 2025, from https://finance.yahoo.com/quote/SNOW/financials

Exploring Investment Strategies: How to Start with Just $1,000

Many people believe you need a large sum of money to start investing, but the truth is you can begin building wealth with as little as $1,000. The key lies in choosing the right strategy that fits your goals, risk tolerance, and timeline.

1. Index Funds

Index funds are one of the simplest and most effective ways to invest. By tracking the performance of a broad market index (like the S&P 500), they offer diversification and steady long-term growth. Historically, index funds have returned around 7–10% annually. With $1,000 invested, the potential compound growth over 10 years could more than double your money.

2. Dividend Stocks

Dividend-paying stocks provide the dual benefit of potential stock price appreciation and regular income through dividend payouts. This strategy appeals to investors who want to generate passive income while also building long-term value. Though returns may vary, reinvesting dividends can accelerate portfolio growth.

3. Bonds

For those seeking stability, bonds remain a trusted option. While the returns are lower compared to stocks, they provide predictable income and are less volatile. A $1,000 bond investment won’t skyrocket in value, but it can help protect capital while earning modest interest.

4. High-Yield Savings Accounts

Technically not an investment in the traditional sense, high-yield savings accounts are a safe place to grow your money while maintaining liquidity. While returns are the smallest of the group, they offer security and immediate access to funds, which is ideal for short-term goals.

Bottom Line

Starting with $1,000 may not make you rich overnight, but it sets the foundation for long-term financial growth. By choosing a strategy that aligns with your needs—whether it’s the steady growth of index funds, the income from dividends, the safety of bonds, or the liquidity of savings—you can begin your journey to building wealth today.

📈 Why Target $TGT Could Be a Solid Income + Growth Pick

High Dividend Yield & Track Record
Target currently pays $4.56 annually ($1.14 per quarter), translating into a robust ~4.9% yield on today’s ~$93 share price (StockAnalysisTipRanks). The company has increased its dividend for 54 consecutive years, a hallmark Dividend King that inspires investor confidence (NasdaqStockAnalysis). Its most recent raise (1.8%) was declared in June 2025, effective with the $1.14 quarterly payment on Sept 1, 2025 (ex-div Aug 13) (Target Corporation).

Payout Coverage & Sustainability
Target retains a payout ratio of roughly 52%—meaning it distributes just over half of earnings as dividends, leaving room to reinvest and buffer downturns (KoyfinStockAnalysis). It also generated ~$2.9 B in free cash flow over the past 12 months, comfortably above its roughly $2 B annual dividend obligation (Nasdaq).

Valuation Lean vs Peers
At a P/E near 11×, Target trades well below peers like Walmart (~37×), suggesting the market has priced in current headwinds—offering potential upside if operational trends normalize over time (Nasdaq).


🧾 Balance Sheet Overview (as of latest trailing 12 mo / August 2025)

Based on S&P-compiled data (StockAnalysisMarketBeat):

📌 Metric💰 Value (USD mm)
Total Assets~$57.9 B
Cash & Equivalents~$4.34 B
Inventories~$12.9 B
PPE (net)~$33.6 B
Total Liabilities~$42.4 B
└ Current Liabilities~$19.2 B
└ Long-Term Debt~$15.4 B
Shareholders’ Equity~$15.4 B (book value ~ $33.9/share)
Net Debt~$16.1 B

Target maintains a healthy asset base, anchored by substantial property, inventory, and cash buffers. Long‐term debt is sizable but manageable given recurring cash flow. Equity has grown steadily (~$14.7 B in FY 2024 to ~$15.4 B TTM), with tangible book value per share near $34—over one-third of share price (StockAnalysis).


🔍 Business Momentum & Outlook

  • Recent performance (Q2 FY 2025):
    Net sales declined ~0.9% YoY and comp sales fell ~1.9%, though digital sales rose ~4.3%. Operating income slipped ~19% to $1.3 B. Full-year EPS guidance remains at $8.00–$10.00 GAAP (adjusted ~$7–$9) (Target Corporation).
  • Strategic tailwinds:
    Investments in same-day fulfillment via Shipt, modernization of logistics, and omnichannel integration are expected to drive margin recovery (expected to improve toward ~6% by FY 2028) (University of Iowa).

💡 Investment Case: Why Consider TGT

  1. Reliable, high income: ~4.9–5.0% yield, backed by decades of increases.
  2. Dividend sustainability: Strong cash flow vs payout; modest payout ratio.
  3. Undemanding valuation: Trading at low P/E, offering value if business stabilizes.
  4. Solid balance sheet: Ample liquidity, reasonable leverage, growing equity.
  5. Long-term turnaround potential: Operational improvements could bolster margins and share price over time.

Risks include macro-sensitive retail environment, margin pressures, inventory mismanagement, and stiff competition. However, the dividend acts as a buffer while strategic moves take root.


📌 Bottom Line

For income-focused investors looking to pair dividend yield with capital appreciation potential, Target (TGT) stands out as a compelling blended opportunity. Its long-standing dividend credibility, backed by solid free cash flow and a durable balance sheet, makes it a defensive anchor in a portfolio. Coupled with low valuation and a clear path to operational recovery, TGT offers both yield today and upside tomorrow.

Disclosure: I currently hold a position in Target Corporation (NASDAQ: $TGT). This article reflects my personal opinions and analysis, and is not intended as financial advice. Please conduct your own research or consult a financial advisor before making any investment decisions.

References

Corporate Target. (2025, June 12). Target Corporation increases quarterly dividend by 1.8 percent. Target Corporate. https://corporate.target.com/press/release/2025/06/target-corporation-increases-quarterly-dividend-by-1-8-percent

Corporate Target. (2025, August 21). Target Corporation reports second quarter 2025 earnings. Target Corporate. https://corporate.target.com/press/release/2025/08/target-corporation-reports-second-quarter-earnings

Koyfin. (2025). Target Corp (TGT) dividend overview. Koyfin. https://www.koyfin.com/company/tgt/dividends/

MarketBeat. (2025). Target financials (NYSE: TGT). MarketBeat. https://www.marketbeat.com/stocks/NYSE/TGT/financials/

Nasdaq. (2025, August 27). 1 green flag for Target stock right now. Nasdaq. https://www.nasdaq.com/articles/1-green-flag-target-stock-right-now-0

Stock Analysis. (2025). Target (TGT) dividend history and growth. Stock Analysis. https://stockanalysis.com/stocks/tgt/dividend/

Stock Analysis. (2025). Target balance sheet (TGT). Stock Analysis. https://stockanalysis.com/stocks/tgt/financials/balance-sheet/

TipRanks. (2025). Target dividend and payout ratio (TGT). TipRanks. https://www.tipranks.com/stocks/tgt/dividends

University of Iowa – Tippie College of Business. (2024). Target Corporation equity research report. https://www.biz.uiowa.edu/henry/download/f24_TGT.pdf

Pfizer’s Dividend Strengthens Case for Long-Term Investors

Pfizer Inc. ($PFE), one of the world’s largest pharmaceutical companies, continues to make a strong case for long-term investors seeking both stability and income. While the stock has faced recent volatility due to a decline in COVID-19 vaccine sales, its solid fundamentals, diversified pipeline, and consistent dividend payouts remain key reasons why investors may want to hold shares for the long haul.

Pfizer currently offers an attractive dividend yield—well above the S&P 500 average—making it a compelling choice for income-focused portfolios. The company has a long track record of reliable dividend payments and has shown commitment to rewarding shareholders even during periods of industry and market uncertainty. With a payout ratio supported by its robust cash flow, Pfizer’s dividend looks sustainable in the years ahead.

Beyond dividends, Pfizer’s pipeline of treatments in oncology, immunology, and rare diseases provides investors with growth opportunities outside of its COVID-19 products. Recent strategic acquisitions, such as the purchase of Seagen to bolster its oncology portfolio, reinforce the company’s long-term vision. These moves are designed to balance near-term headwinds with future revenue expansion.


Financial Snapshot: Strengths and Weaknesses

Strengths

  • Dividend Yield & Stability: Pfizer’s dividend yield is significantly higher than the S&P 500 average, appealing to income-focused investors.
  • Strong Balance Sheet: Despite recent revenue declines, Pfizer maintains healthy cash reserves and strong operating cash flow, supporting its dividend and acquisition strategy.
  • Attractive Valuation: Shares are trading at a discount compared to peers in the pharmaceutical sector, offering a margin of safety for value investors.
  • Diversified Revenue Base: Expansion in oncology, vaccines, and rare diseases provides multiple future growth drivers beyond COVID-19.

Weaknesses

  • COVID-19 Dependency Hangover: A sharp decline in vaccine and antiviral demand has pressured revenue, highlighting reliance on pandemic-era products.
  • R&D Risk: Heavy investment in research and development may not always lead to successful approvals, leaving earnings vulnerable.
  • Debt from Acquisitions: The Seagen deal adds to Pfizer’s debt load, which, while manageable, could strain resources if integration challenges arise.
  • Patent Expirations: Like many pharmaceutical giants, Pfizer faces long-term risks from patent cliffs that could erode future revenue streams.

Stock Price Outlook: 1 to 5 Years

Pfizer’s current share price reflects market concerns over post-COVID revenue declines, but its fundamentals suggest room for recovery.

  • 12-Month View (2025–2026): Analysts see potential for modest gains, with shares trading in the $32–$38 range as the market digests lower vaccine revenues but begins to price in oncology and pipeline growth. The dividend will continue to anchor returns even if share price growth is muted.
  • 3-Year View (2027): As new oncology therapies, rare-disease drugs, and vaccine innovations mature, Pfizer could see revenue stabilize and return to growth. A reasonable target range could be $40–$48 per share, supported by mid-single-digit revenue growth and steady dividends.
  • 5-Year View (2029–2030): If Pfizer successfully integrates Seagen, brings key drugs to market, and manages upcoming patent expirations, long-term investors could see shares trading in the $50–$60 range. Dividend reinvestment along the way would enhance total returns, making Pfizer a solid long-term hold for income plus growth.

While uncertainty remains in the short term, Pfizer’s combination of a reliable dividend, undervaluation relative to peers, and a promising pipeline suggests patient investors may be rewarded over a 5-year horizon.

Disclosure: I currently hold a position in Pifzer (NASDAQ: $PFE). This article reflects my personal opinions and analysis, and is not intended as financial advice. Please conduct your own research or consult a financial advisor before making any investment decisions.