A growing number of professionals and behavioral economists are challenging the narrative: what if the real key to fulfillment isn’t how much you earn, but how you think about what you have?
This shift in perspective often referred to as a “wealth mindset reset” is gaining traction across industries, from finance to mental health. The premise is straightforward: when individuals focus less on income comparisons and more on positive drivers like stability, growth, and purpose, they tend to experience higher levels of satisfaction and long-term success.
The Problem with Income Obsession
For decades, income has been the most visible and measurable indicator of success. Promotions, bonuses, and salary benchmarks are easy to quantify. But that clarity comes with a downside.
“Constantly measuring yourself against others financially creates a moving target,” says one financial wellness expert. “There’s always someone earning more, which can lead to chronic dissatisfaction even when you’re objectively doing well.”
This phenomenon is closely tied to relative income theory, where happiness is influenced less by absolute earnings and more by how one stacks up against peers. The result? Even high earners can feel financially insecure.
Reframing Success
Instead of anchoring self-worth to income, experts recommend shifting focus toward controllable and meaningful metrics:
Financial Stability – Are your essential needs covered? Do you have a safety net?
Progress – Are you improving your skills, growing your career, or expanding your opportunities?
Autonomy – Do you have control over your time and decisions?
Purpose – Does your work align with your values or provide a sense of contribution?
These factors, while less tangible than a paycheck, have a stronger correlation with long-term well-being.
The Psychology of Positive Focus
Research in positive psychology suggests that gratitude and forward-looking thinking can significantly improve both mental health and productivity. When individuals focus on what’s working rather than what’s lacking they’re more likely to make better decisions, take calculated risks, and build sustainable habits.
In practical terms, this could mean recognizing consistent income instead of chasing sporadic spikes, or valuing flexibility in a job over a marginal salary increase.
A Financial Strategy Hidden in Plain Sight
Interestingly, this mindset isn’t just about feeling better it can also lead to smarter financial behavior.
People who aren’t fixated on income alone are more likely to:
Save consistently rather than spend to “keep up”
Invest with a long-term perspective
Avoid high-risk decisions driven by short-term gain
Build diversified income streams over time
In essence, focusing on positives creates a more disciplined and resilient financial strategy.
Real-World Application
Consider two individuals earning the same salary. One constantly compares themselves to higher earners, feels behind, and takes on unnecessary financial risks. The other focuses on steady growth, appreciates their progress, and makes calculated decisions.
Over time, the second individual is more likely to build sustainable wealth not necessarily because they earn more, but because they think differently.
In the End
Income will always matter it’s a fundamental part of financial security. But it’s not the full picture. By shifting attention away from “how much” and toward “how well,” individuals can unlock a more balanced, productive, and ultimately rewarding financial life.
In a world obsessed with numbers, the real advantage may belong to those who learn to look beyond them.
For individuals entering the investment world, the sheer volume of choices like individual stocks, bonds, options, commodities, and more can feel overwhelming. Exchange-Traded Funds, commonly known as ETFs, have emerged as one of the most practical and efficient starting points for new investors. By combining diversification, accessibility, and flexibility, ETFs offer exposure to broad segments of the market while minimizing many of the risks associated with selecting individual securities.
Yet while ETFs are powerful tools, they are not a cure-all. Understanding both their capabilities and limitations is essential before incorporating them into a long-term investment strategy.
What Is an ETF?
An Exchange-Traded Fund is a pooled investment vehicle that trades on a stock exchange, much like an individual stock. Each ETF holds a basket of underlying assets such as stocks, bonds, commodities, or other securities. When you purchase one share of an ETF, you are effectively purchasing partial ownership in all the assets within that fund.
For example:
An S&P 500 ETF provides exposure to 500 of the largest U.S. companies.
A bond ETF provides exposure to government or corporate debt.
A sector ETF might focus solely on technology, healthcare, or energy.
This structure allows investors to diversify their portfolio instantly with a single transaction.
Why ETFs Are an Ideal Starting Point for Beginners
1. Instant Diversification
One of the biggest risks new investors face is concentration risk putting too much money into a single stock. ETFs mitigate this by spreading investments across dozens, hundreds, or even thousands of securities.
Instead of betting on one company, you can invest in an entire market segment.
2. Lower Costs Compared to Mutual Funds
Most ETFs are passively managed, meaning they track an index rather than relying on expensive active management. As a result, expense ratios are typically very low—often under 0.10% annually.
Lower fees translate into higher long-term returns, as fees compound negatively over time.
3. Ease of Trading
ETFs trade throughout the day on stock exchanges, just like individual stocks. Investors can buy or sell at any time during market hours, providing flexibility and liquidity.
4. Transparency
Most ETFs disclose their holdings daily, allowing investors to see exactly what they own. This transparency helps investors make informed decisions.
5. Accessibility
Many brokerage platforms allow investors to purchase ETFs with no commissions and relatively small amounts of capital.
Chart: Trade Opportunities Available Through ETFs
Trade Opportunity
ETF Example Type
Risk Level
Potential Reward
Best For
Broad Market Exposure
S&P 500 ETF
Moderate
Steady long-term growth
Beginners, retirement investors
Sector Investing
Technology or Healthcare ETF
Moderate-High
Higher growth potential
Investors targeting specific industries
Dividend Income
Dividend ETF
Low-Moderate
Passive income + growth
Income-focused investors
Bond Exposure
Treasury or Corporate Bond ETF
Low
Stability and income
Conservative investors
International Markets
Emerging Markets ETF
High
High growth potential
Diversification seekers
Commodity Exposure
Gold or Oil ETF
High
Inflation hedge
Advanced diversification
Thematic Investing
AI, Clean Energy ETF
High
Significant upside potential
Growth-oriented investors
Defensive Investing
Consumer Staples ETF
Low-Moderate
Stability during downturns
Risk-averse investors
What ETFs Can Do for You
Provide Diversification Efficiently
ETFs allow investors to spread risk across multiple companies and sectors without needing large amounts of capital.
Reduce Emotional Decision-Making
Instead of worrying about individual company performance, ETFs allow investors to focus on broader economic trends.
Build a Strong Long-Term Foundation
Many retirement portfolios are built primarily using broad-market ETFs due to their consistency and reliability.
Offer Exposure to Specialized Markets
ETFs make it possible to invest in areas that would otherwise be difficult to access, such as foreign markets, commodities, or niche sectors.
What ETFs Cannot Do for You
Guarantee Profits
ETFs follow the market. If the overall market declines, ETFs will decline as well.
Eliminate Risk
While diversification reduces risk, it does not eliminate it. Market downturns affect most ETFs.
Outperform the Market Consistently
Most ETFs are designed to match market performance, not exceed it.
Protect Against Poor Investment Timing
Buying during market highs can still lead to temporary losses, even with diversified ETFs.
ETFs vs Individual Stocks: Risk Comparison
Feature
ETFs
Individual Stocks
Diversification
High
Low
Risk Level
Moderate
High
Volatility
Lower
Higher
Research Required
Moderate
High
Potential Reward
Moderate-High
High
Loss Potential
Reduced
Significant
Why Many Professionals Recommend ETFs First
Warren Buffett, one of the most successful investors in history, has repeatedly recommended low-cost index ETFs for most investors. His reasoning is simple: consistently beating the market is extremely difficult, even for professionals.
ETFs allow investors to participate in overall economic growth without needing to predict which individual companies will succeed.
The Bottom Line
Exchange-Traded Funds represent one of the most efficient and accessible tools available to new investors. They offer instant diversification, low costs, transparency, and flexibility—making them an ideal starting point for building wealth.
However, investors must understand that ETFs are not risk-free. They reflect the performance of the underlying markets, meaning patience, discipline, and long-term thinking remain essential.
For those beginning their investment journey, ETFs provide something invaluable: a balanced and intelligent way to participate in the market while learning and growing as an investor.
Over time, they can serve not just as a starting point but as the foundation of a successful financial future.
References
Buffett, W. E. (2017). The essays of Warren Buffett: Lessons for corporate America (5th ed.). Carolina Academic Press.
Investment Company Institute. (2024). 2024 investment company fact book. https://www.ici.org
Morningstar, Inc. (2025). ETF investing guide: Understanding exchange-traded funds. https://www.morningstar.com
Securities and Exchange Commission. (2023). Exchange-traded funds (ETFs). U.S. Securities and Exchange Commission. https://www.sec.gov
U.S. Securities and Exchange Commission. (2024). Beginner’s guide to asset allocation, diversification, and rebalancing. https://www.investor.gov
Vanguard Group. (2024). Understanding ETFs: Benefits and risks. Vanguard. https://www.vanguard.com
BlackRock. (2025). ETF basics: What is an ETF? iShares by BlackRock. https://www.ishares.com
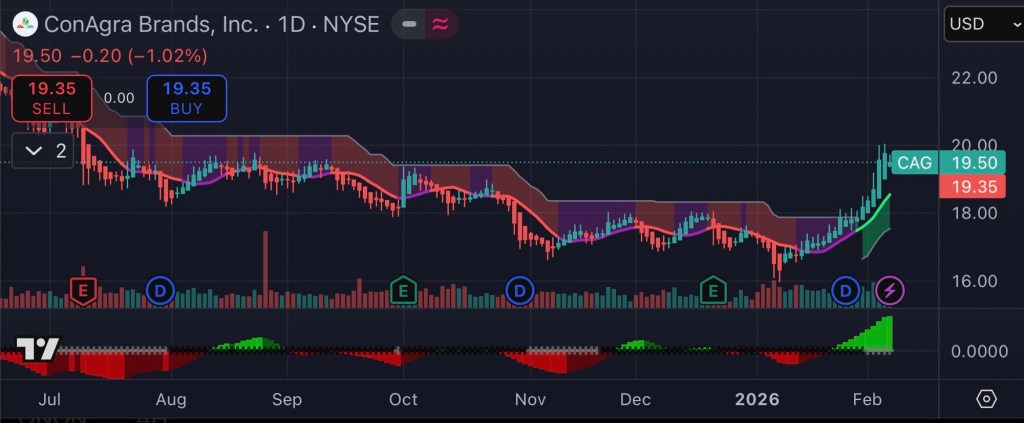
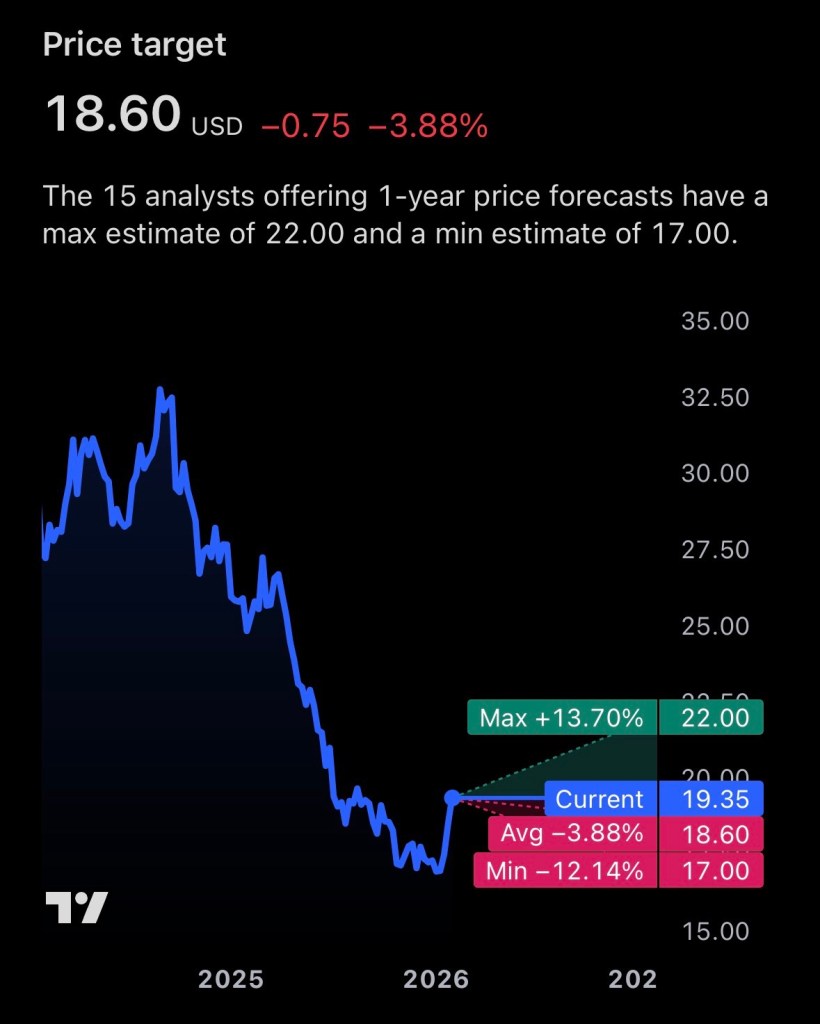
Conagra Brands, Inc. (NYSE: CAG), one of America’s largest packaged food companies and owner of iconic brands such as Birds Eye, Slim Jim, Healthy Choice, and Marie Callender’s, has emerged as a compelling investment candidate for income-focused investors. Despite recent operational challenges and declining share price performance, the company’s unusually high dividend yield, stable cash flows, and historically low valuation may present an attractive risk-reward profile for long-term investors willing to tolerate near-term volatility.
Current Stock Price and Market Position
As of early February 2026, Conagra Brands shares are trading at approximately $19.55 per share, near the lower end of their 52-week range of $15.96 to $28.52. The company currently carries a market capitalization of roughly $8.8–$8.9 billion and generates annual revenue of approximately $11.23 billion, underscoring its significant presence in the consumer staples sector.
However, the stock has declined more than 26% over the past year, reflecting investor concerns about declining sales volume, rising costs, and shifting consumer preferences.
While these headwinds have weighed on investor sentiment, they have also created a rare combination of depressed valuation and elevated income potential.
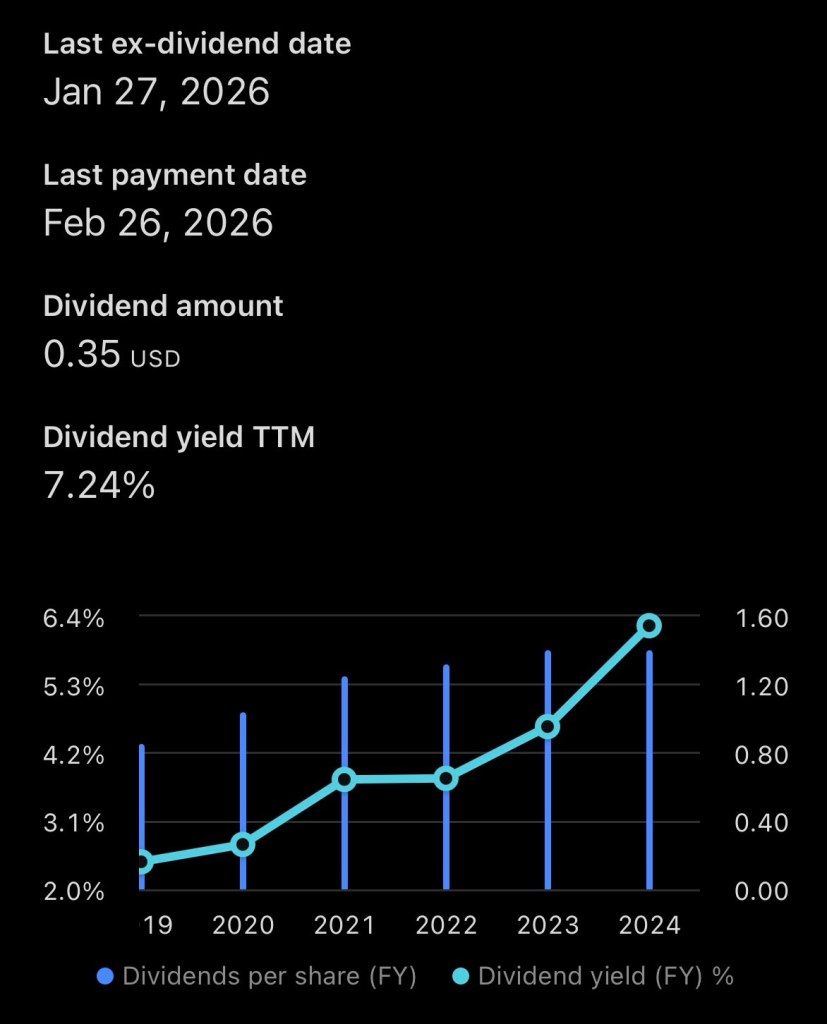
Dividend Yield: A Major Strength for Income Investors
Conagra Brands’ most compelling investment characteristic is its dividend.
Annual dividend: $1.40 per share
Dividend yield: Approximately 7.16% to 7.89% depending on price fluctuations
Dividend payout frequency: Quarterly
Dividend history: Over 160 dividend payments since 1985
This yield is significantly higher than the broader S&P 500 average, which typically ranges between 1.5% and 2.0%.
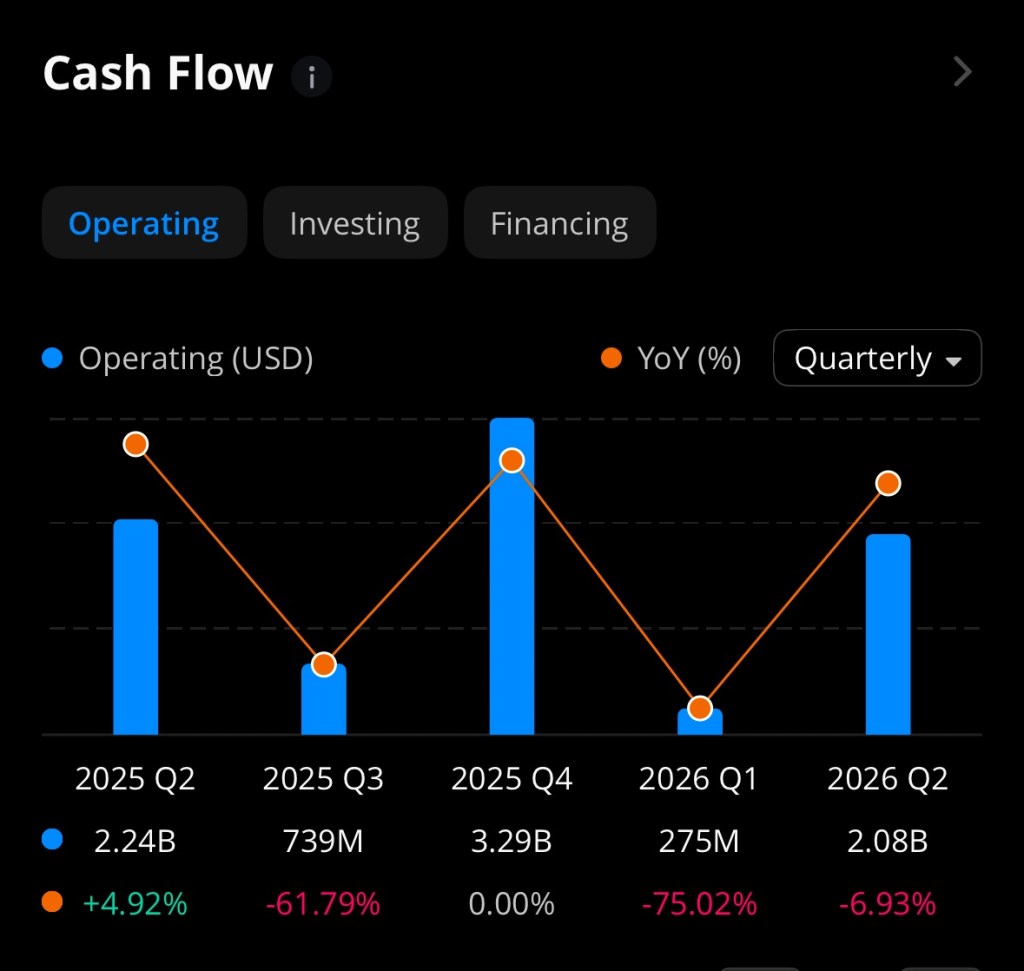
Even more importantly, Conagra generates strong free cash flow—approximately $1.14 billion annually—which supports its dividend payments and enhances their sustainability.
The company’s dividend payout ratio based on forward estimates ranges between 45% and 59% of cash flow, indicating the dividend is supported by underlying earnings power rather than excessive borrowing.
For investors seeking income, this dividend alone provides substantial annual returns regardless of stock price appreciation.
One of the most compelling reasons investors may consider Conagra today is its relatively low valuation.
Key valuation metrics include:
Forward price-to-earnings ratio: Approximately 10.4
Free cash flow yield: 13.4%
Book value per share: $18.64 (close to current share price)
These metrics suggest the stock is trading near its intrinsic asset value, with investors effectively paying a modest premium for a business that generates over $1 billion annually in free cash flow.
Historically, consumer staples companies trade at higher multiples due to their predictable cash flows and defensive characteristics. A forward P/E ratio near 10 places Conagra at a meaningful discount compared to many peers.
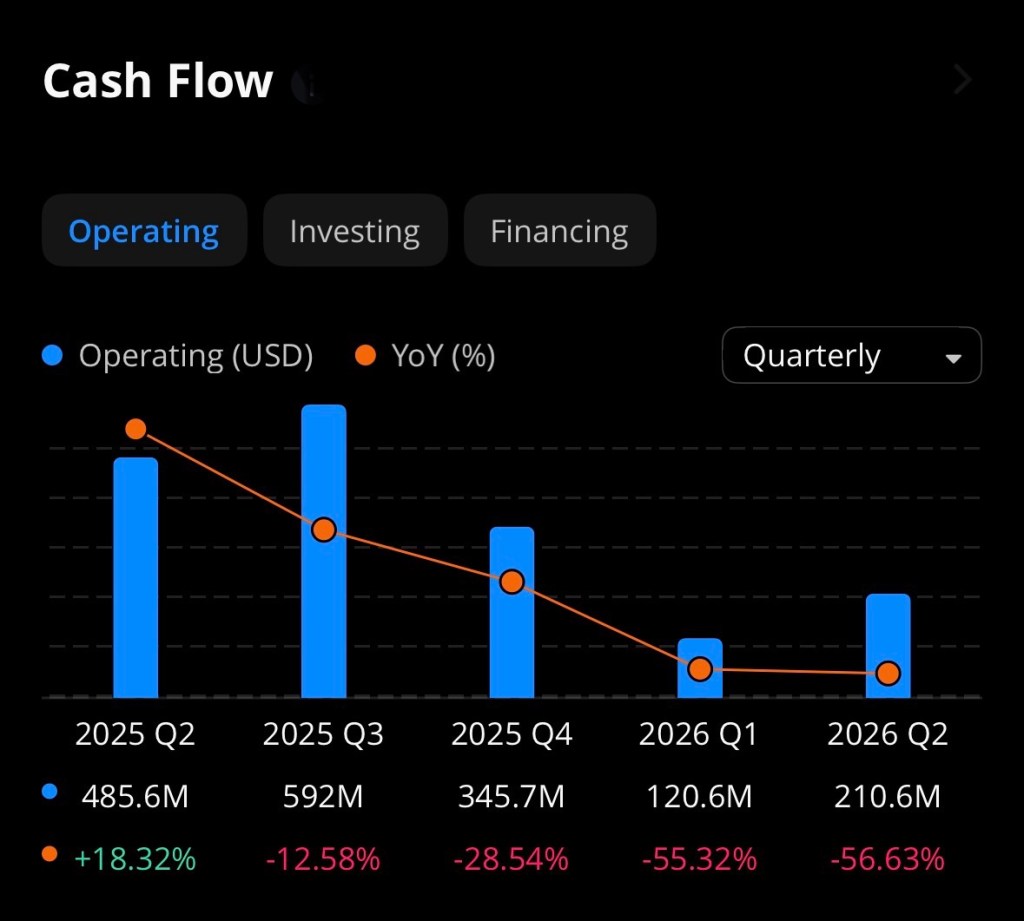
Cash Flow and Financial Strength Support Long-Term Stability
Despite near-term earnings pressures, Conagra remains fundamentally profitable and cash-generating.
Financial highlights include:
Operating cash flow: $1.54 billion annually
Free cash flow: $1.14 billion annually
Gross margin: 25.5%
Operating margin: 13.83%
These metrics demonstrate that even in a challenging economic environment, Conagra continues to generate meaningful profit margins.
Consumer staples companies like Conagra also tend to be more resilient during economic downturns, as demand for packaged food remains relatively stable regardless of broader economic conditions.
Recent Challenges Have Created Opportunity
Recent operational challenges have contributed to the stock’s decline, including:
Volume declines due to inflation-sensitive consumers
Rising raw material costs, particularly meat prices
Impairment charges and slower growth expectations
However, these challenges appear cyclical rather than structural.
Importantly, Conagra has reaffirmed its long-term outlook and continues investing in efficiency improvements, pricing strategies, and portfolio optimization.
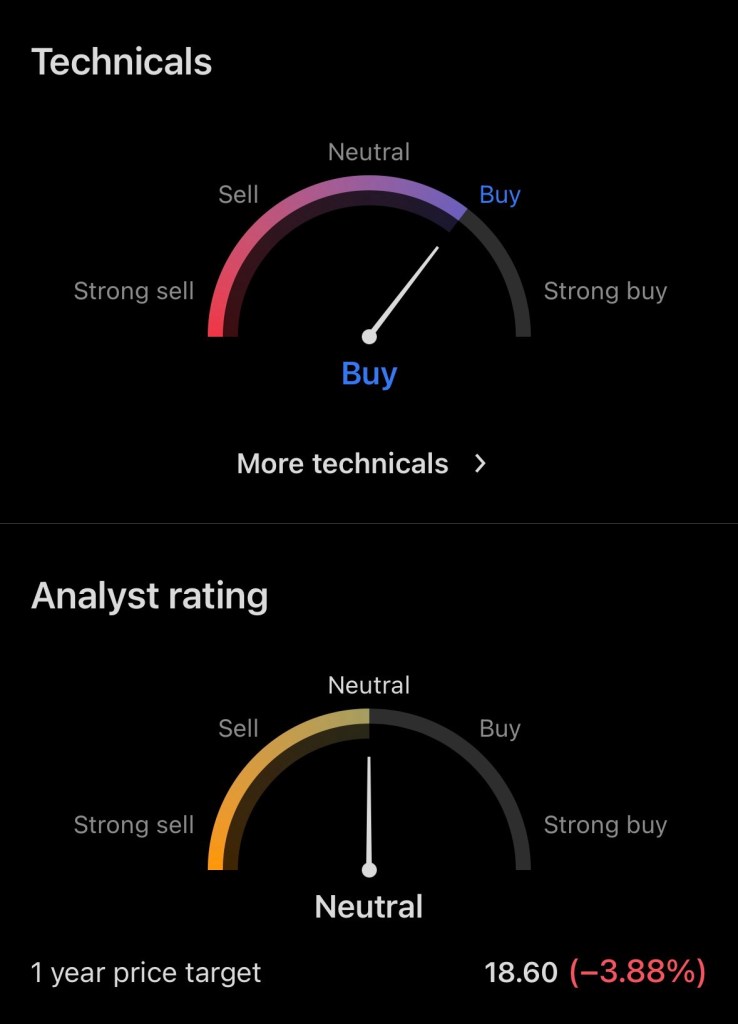
Analyst Price Target and Future Outlook
Wall Street analysts currently maintain an average price target of approximately $20.58, representing potential upside of about 16% from current levels.
Even more conservative targets suggest modest appreciation potential, while income investors collect a substantial dividend while waiting.
Reasonable 12-Month Price Projection
Based on:
Historical valuation multiples
Dividend yield normalization
Improving cost pressures
Stable consumer demand
A realistic one-year price range for Conagra Brands is:
Base Case: $20–$23 Bull Case: $24–$26 Bear Case: $17–$19
In addition to capital appreciation, investors could receive approximately 7% annual income, significantly enhancing total returns.
Total Return Potential: Combining Dividend and Price Recovery
If shares rise from $19.55 to $22.50 over the next year:
Capital gain: ~15%
Dividend yield: ~7%
Total return potential: ~22%
This level of total return potential is unusually high for a defensive consumer staples company.
Why Conagra Brands May Be a Strong Investment Choice
Key investment strengths include:
1. Exceptionally High Dividend Yield Nearly 7–8%, far above market averages.
3. Low Valuation Relative to Cash Flow and Assets Forward P/E near 10 suggests undervaluation.
4. Defensive Industry Position Food companies benefit from consistent consumer demand.
5. Potential Price Recovery as Conditions Improve Even modest improvement could drive meaningful upside.
Investment Risks
Despite its strengths, investors should consider potential risks:
High debt levels (~$8.28 billion)
Slowing revenue growth
Inflation and commodity cost pressures
Changing consumer dietary preferences
These risks explain the stock’s depressed valuation but also contribute to its opportunity.
Conclusion: Attractive Income Play with Recovery Potential
Conagra Brands represents a classic high-yield, undervalued income stock. While recent operational challenges have pushed shares lower, the company continues generating strong cash flow and paying a highly attractive dividend.
For income-focused investors and those seeking undervalued defensive stocks, Conagra offers:
Strong income potential
Possible capital appreciation
Defensive consumer staples exposure
If operational performance stabilizes and investor sentiment improves, Conagra Brands could deliver both income and moderate capital gains over the coming year.
Disclosure
The author currently holds a position in Conagra Brands (CAG). This article is for informational purposes only and should not be considered financial advice. Investors should conduct their own research or consult a financial advisor before making investment decisions.
Mission Produce, Inc. (NASDAQ: AVO) is a vertically integrated supplier of fresh Hass avocados (and growing categories such as blueberries and mangoes). The company’s mission centers on reliably sourcing, ripening, packing and distributing high-quality avocados year-round while expanding into complementary produce categories to smooth seasonality and add higher-margin lines for customers. (SEC+1)
Why some investors call $AVO a “hidden gem” • Scale in a tight market: Mission Produce reported trailing-12-month revenue of roughly $1.4B (TTM), driven by higher selling prices and broadening sourcing to Peru, Mexico, Guatemala and other regions — giving it scale in an industry with frequent supply shocks. (Yahoo Finance+1) • Recent momentum in results: the company reported Q2 fiscal-2025 revenue of $380.3M (up ~28% year-over-year) and continued quarter-to-quarter revenue strength into Q3, reflecting strong demand and price environment for Hass avocados. Those beats have grabbed investor attention. (Mission Produce Investors+1) • Diversification & supply-footprint: Mission is investing in packhouses and farming operations (including expansion in Guatemala and development of blueberry and mango programs), which helps reduce single-market exposure and gives operational levers when avocado prices swing. (Blue Book Services+1) • Clean-ish balance sheet for a seasonal ag business: total assets are roughly $1.0B with total liabilities around $402M (SEC filings / investor materials show positive shareholders’ equity and manageable long-term debt) — positioning it to withstand seasonal price swings and invest in capacity. (SEC+1)
Key risks • Commodity and weather risk: avocados are sensitive to weather (El Niño, droughts) and geopolitical trade/tariff moves; supply disruptions can quickly swing margins. (MarketWatch) • Price cyclicality: the company’s Marketing & Distribution segment drives most revenue, so falling avocado prices can reduce top-line even as volumes rise. (Cash Flow Templates)
📈 Current Price & 12-Month Outlook
As of December 4, 2025, AVO shares trade around US$12.03 per share. (MarketBeat+2StockAnalysis+2) According to recent analyst consensus, many project a 12-month target price of about US $17.00 — implying a potential upside of roughly 40–45% over the next year. (StockAnalysis+2Zacks+2)
If conditions remain favorable — robust demand for avocados, stable supply (including from diversified growing regions), and continued execution on expansion initiatives — AVO could reach or even modestly exceed that $17 target. However, risks such as commodity-price swings, weather events, and shifting consumer demand could temper gains. As with all agriculture-linked equities, the upside remains meaningful but also volatile.
Bottom line Mission Produce combines market leadership in a high-growth consumer category (avocados), rising scale and an improving product mix. That combination — plus a balance sheet that appears able to support continued investment — is why some investors view $AVO as a “hidden gem” in ag/food distribution. But it remains a cyclical, weather-sensitive play; prospective buyers should weigh valuation, seasonality, and tariff/volume outlooks before acting. (Yahoo Finance+1)
Disclosure: I currently hold a position in Mission Produce, Inc. (NASDAQ: AVO). All information provided is for informational and educational purposes only and should not be interpreted as financial advice, investment recommendations, or an endorsement to buy or sell any security. Investors should conduct their own research and consult with a qualified financial professional before making investment decisions.
Cohen & Steers Infrastructure Fund, Inc. (ticker: UTF) is a closed-end fund that invests primarily in listed infrastructure companies utilities, pipelines, toll roads, telecoms and similar businesses with an emphasis on income and total return. The fund targets at least 80% exposure to infrastructure securities and is permitted to hold preferreds and fixed-income as well. (Cohen & Steers+1)
The case for UTF in a downturn
High and steady monthly distribution. UTF pays a monthly cash distribution (recently about $0.155 per share) that translates to a forward annualized dividend around the high-single to mid-single digits (roughly a 7–8% yield at current market prices). That regular payout can make UTF attractive to income-seeking investors during equity market weakness. (Cohen & Steers Resources+1)
Defensive underlying exposure. Infrastructure companies often provide essential services (power, water, roads, telecom) with relatively stable cash flows and regulatory protections that can soften downside in economic contractions compared with cyclical sectors. UTF’s strategy explicitly focuses on these companies and includes income-oriented holdings (common equity plus a portion in preferreds/fixed income). (SEC+1)
Closed-end structure can add opportunity. As a closed-end fund, UTF can trade at a premium or discount to net asset value (NAV) and use leverage or share repurchases to enhance returns. In downturns, discounts can widen and create potential buying opportunities for investors seeking yield and income—though discounts can also persist. Recent fund documents show management tools (repurchase programs, rights offerings) are in use when needed. (Cohen & Steers+1)
Relative price stability historically. While all market securities fall in tough selloffs, UTF’s share price history shows less extreme volatility than many small-cap or tech names because of its income focus and infrastructure holdings. (See sources below for historical price and distribution history.) (Yahoo Finance+1)
Total-return potential from dividends + capital. In a downturn the regular dividend cushions total returns. If the portfolio’s underlying cash flows remain intact, the dividend can provide an attractive yield while capital recoveries occur — particularly for buy-and-hold income investors.
Risks you must weigh
Discount/premium risk: CEFs can trade at large, persistent discounts to NAV; the market price might not reflect NAV recovery quickly. (CEF Connect)
Leverage and interest-rate sensitivity: Some closed-end funds use leverage that can magnify losses when markets fall and can increase sensitivity to rising rates. UTF’s prospectus and factsheet discuss leverage and fixed-income exposure. (Cohen & Steers Resources+1)
Concentration risk: Heavy exposure to infrastructure and related subsectors means sector-specific shocks (regulatory, energy shocks, etc.) can hit performance. (SEC)
Analysts don’t always publish a single consensus price target for closed-end funds like UTF; where a consensus target isn’t available, a scenario approach is often more informative. Below I created three plausible projected price scenarios for the next 12 months — Bear (–15% y), Baseline (+4% y) and Bull (+25% y) — starting from the recent market close (~$24.20). These are illustrative projections (not predictions or investment advice), intended to show how price paths and total return dynamics might look under different macro/backdrop outcomes.
Key assumptions used for the chart: start price $24.20, monthly compounding equivalent to the annual scenario rates listed above. These scenarios do not include dividends — they show market-price outcomes only (adding dividends would materially improve total returns, especially at a ~7–8% yield).
Quick takeaways
UTF’s monthly dividend and exposure to essential infrastructure make it a reasonable consideration for income-focused investors during market downturns; the dividend can provide cashflow support while equity markets recover. (Cohen & Steers Resources+1)
However, because UTF is a closed-end fund, price movements can diverge from underlying NAV and be influenced by fund-specific factors (discounts, leverage, corporate actions). That tradeoff (high yield vs. structural CEF risks) is central to whether UTF is appropriate for any individual portfolio. (Cohen & Steers+1)
Disclosure
I currently hold a position in the Cohen & Steers Infrastructure Fund (UTF). This information is provided for educational and informational purposes only and should not be considered financial advice. Always conduct your own research and consult with a qualified financial professional before making any investment decisions.
DividendMax. (n.d.). Cohen & Steers Infrastructure Fund dividend information. Retrieved from https://www.dividendmax.com/
SEC. (n.d.). Cohen & Steers Infrastructure Fund, Inc. (UTF) — Prospectus & filings. U.S. Securities and Exchange Commission. Retrieved from https://www.sec.gov/
StockAnalysis.com. (n.d.). UTF: Cohen & Steers Infrastructure Fund stock dividend & history. Retrieved from https://stockanalysis.com/
Yahoo Finance. (n.d.). UTF — Cohen & Steers Infrastructure Fund price & chart data. Retrieved from https://finance.yahoo.com/
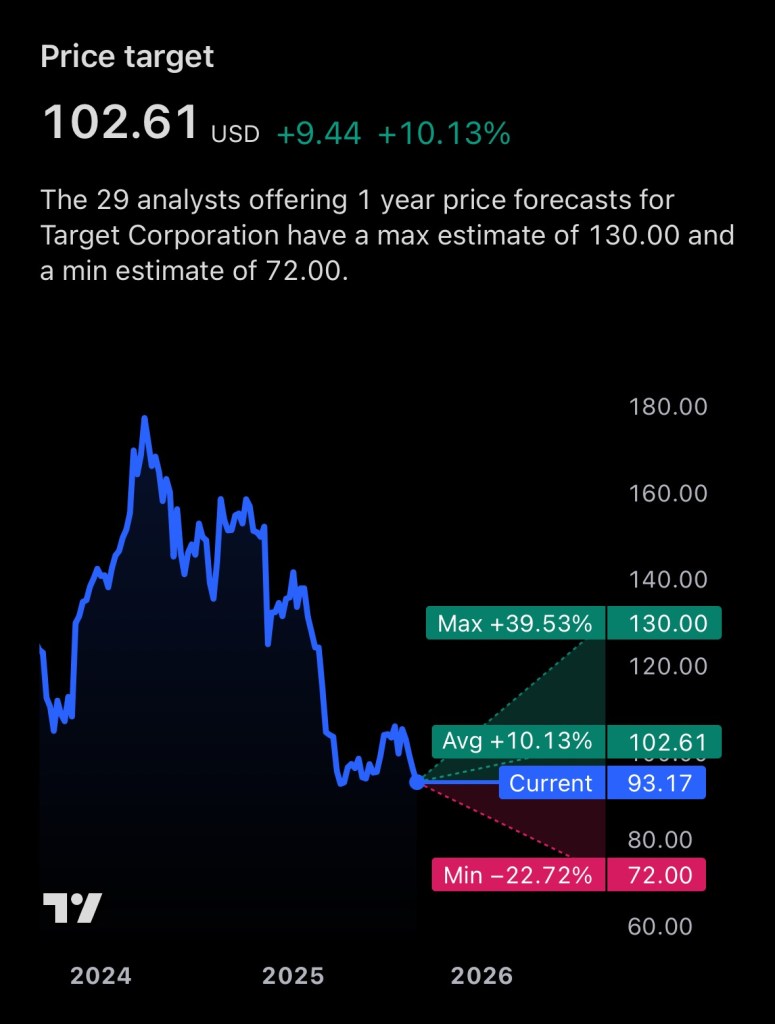
High Dividend Yield & Track Record Target currently pays $4.56 annually ($1.14 per quarter), translating into a robust ~4.9% yield on today’s ~$93 share price (StockAnalysisTipRanks). The company has increased its dividend for 54 consecutive years, a hallmark Dividend King that inspires investor confidence (NasdaqStockAnalysis). Its most recent raise (1.8%) was declared in June 2025, effective with the $1.14 quarterly payment on Sept 1, 2025 (ex-div Aug 13) (Target Corporation).
Payout Coverage & Sustainability Target retains a payout ratio of roughly 52%—meaning it distributes just over half of earnings as dividends, leaving room to reinvest and buffer downturns (KoyfinStockAnalysis). It also generated ~$2.9 B in free cash flow over the past 12 months, comfortably above its roughly $2 B annual dividend obligation (Nasdaq).
Valuation Lean vs Peers At a P/E near 11×, Target trades well below peers like Walmart (~37×), suggesting the market has priced in current headwinds—offering potential upside if operational trends normalize over time (Nasdaq).
🧾 Balance Sheet Overview (as of latest trailing 12 mo / August 2025)
Target maintains a healthy asset base, anchored by substantial property, inventory, and cash buffers. Long‐term debt is sizable but manageable given recurring cash flow. Equity has grown steadily (~$14.7 B in FY 2024 to ~$15.4 B TTM), with tangible book value per share near $34—over one-third of share price (StockAnalysis).
🔍 Business Momentum & Outlook
Recent performance (Q2 FY 2025): Net sales declined ~0.9% YoY and comp sales fell ~1.9%, though digital sales rose ~4.3%. Operating income slipped ~19% to $1.3 B. Full-year EPS guidance remains at $8.00–$10.00 GAAP (adjusted ~$7–$9) (Target Corporation).
Strategic tailwinds: Investments in same-day fulfillment via Shipt, modernization of logistics, and omnichannel integration are expected to drive margin recovery (expected to improve toward ~6% by FY 2028) (University of Iowa).
💡 Investment Case: Why Consider TGT
Reliable, high income: ~4.9–5.0% yield, backed by decades of increases.
Dividend sustainability: Strong cash flow vs payout; modest payout ratio.
Undemanding valuation: Trading at low P/E, offering value if business stabilizes.
Long-term turnaround potential: Operational improvements could bolster margins and share price over time.
Risks include macro-sensitive retail environment, margin pressures, inventory mismanagement, and stiff competition. However, the dividend acts as a buffer while strategic moves take root.
📌 Bottom Line
For income-focused investors looking to pair dividend yield with capital appreciation potential, Target (TGT) stands out as a compelling blended opportunity. Its long-standing dividend credibility, backed by solid free cash flow and a durable balance sheet, makes it a defensive anchor in a portfolio. Coupled with low valuation and a clear path to operational recovery, TGT offers both yield today and upside tomorrow.
Disclosure: I currently hold a position in Target Corporation (NASDAQ: $TGT). This article reflects my personal opinions and analysis, and is not intended as financial advice. Please conduct your own research or consult a financial advisor before making any investment decisions.